Source address: https://pjreddie.com/media/files/papers/YOLOv3.pdf
Code: https://github.com/qqwweee/keras-yolo3
summary
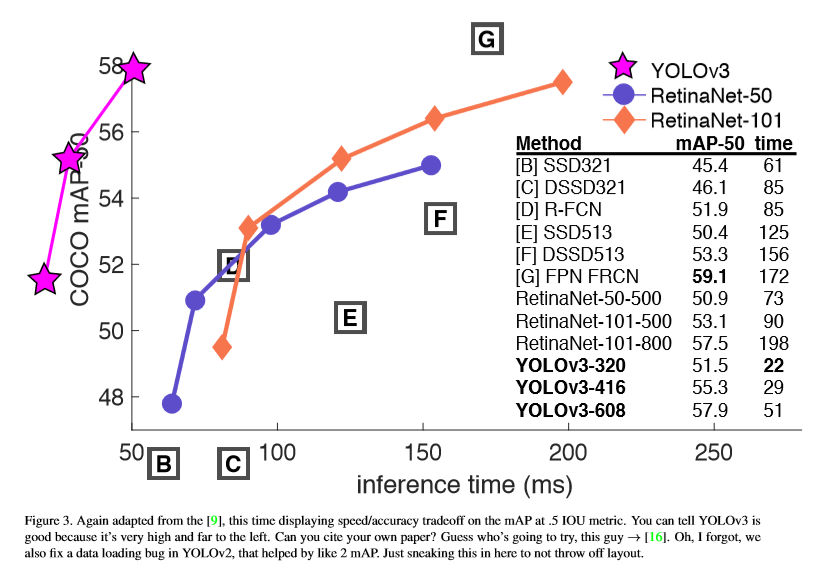
In this paper, the Yolo is improved again to train a larger network, and the accuracy is also improved. On 320×320 input, yolov3 runs for 22ms, and the map is 28.2, which is the same as SSD, but three times faster than SSD. When using 0.5 IOU as the detection mechanism, yolov3 still performs well. Running 57.9 ap50 for 51ms on Titan x, while running 57.5 ap50 for 198ms on retinamnet, yolov3 is 3.8 times faster.
The Deal
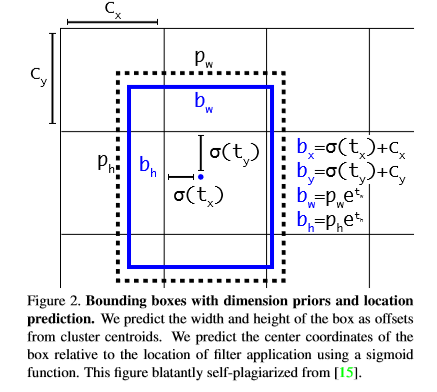
forecasting of bounding box : it follows the way of yolo9000 and still adopts the way of dimension aggregation. The network predicts the four coordinates of each bounding box, TX, ty, TW, th. If the cell deviates from the upper left corner of the image (CX, CY), and the width and height of the prior box are PW, pH, the predicted value is:
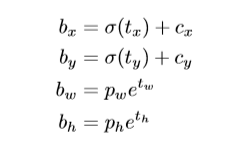
When training, select the sum of square error loss, the true value corresponding to the prediction coordinate is  , the gradient calculation is the true value minus the predicted value, and
  can get the true value by flipping the above formula. Yolov3 predicts the target score of each bounding box by using logistic regression. If the coincidence rate of a priori box with ground truth is more than that of other priori boxes, the target score of the box should be 1. For the priori box that overlaps with the target in ground truth and exceeds the threshold (this is set to 0.5), but is not the best, remove the prediction. If a priori box does not have a ground truth to match it. There is no predicted loss of categories and coordinates. Only the loss description of whether there is a target.
category prediction : multi category classifiers are used to predict and classify the categories that may be included in each box. Yolov3 does not use softmax, but uses independent logistic regression classifier. In training, binary cross entropy loss is used to predict the category. When facing more complex situations (open data set, which has a large number of overlapping tags), this method will help. However, using softmax based on the assumption that each box contains only one category is not practical, and using multi tag method can better describe the data.
prediction of different sizes : yolov3 predicts three different sizes. Yolov3 uses a structure similar to FPN network to extract multi-dimensional features. The basic convolution layer is added after the basic feature extraction layer. Finally, we predict a 3D tensor, encoding bounding box, objectness and category. In coco, each size predicts three boxes, so the tensor is nxnxnx [3 * (4 + 1 + 80)], representing four coordinates, one objectness and 80 categories respectively. Take the feature map of the first two layers to enlarge the upper sampling to 2 times, and then splice the sampled feature map with the feature map of the front layer. More semantic information can be obtained by up sampling, and the detail information of the image can be obtained by extracting the feature map of the front layer. Finally, some convolution layers are added to process the stitched feature map, and the tensor is predicted to expand the current size. Repeat this method to predict the last size. The third way is to store the predicted results in combination with the previous calculation (equivalent to the fine tuned feature map).
K-means is still used to determine the prior box, and 9 clusters and 3 sizes are selected arbitrarily. The nine prior frames obtained on coco dataset are (10 × 13), (16 × 30), (33 × 23), (30 × 61), (62 × 45), (59 × 119), (116 × 90), (156 × 198), (373 × 326)
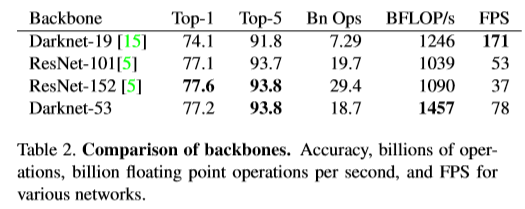
feature extraction : use a new network for feature extraction. The network based on yolov2 combines darknet19 with residual structure. It contains a series of convolutions of 3×3 and 1×1, mixed with residual connections, and the network scale becomes larger, which is called darknet-53.
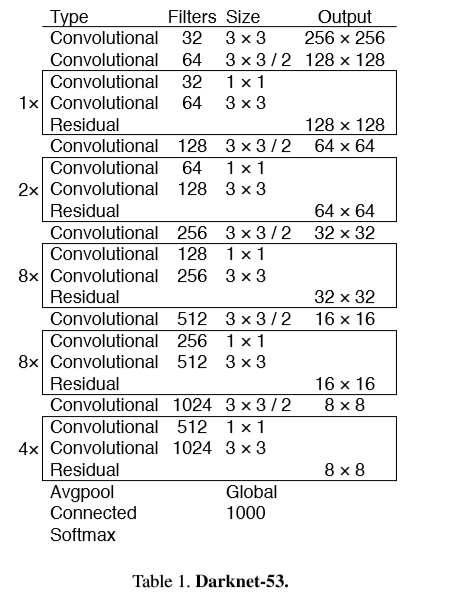
Darknet-53 is more efficient than darknet-19 and faster than resnet-101 and resnet-152. The comparison results are as follows.
experimental comparison

the scheme of experiment failure:
(1)Anchor box x,y offset predictions
(2)Linear x,y predictions instead of logistic.
(3)Focal loss.
(4)DualIOUthresholdsandtruthassignment.
Reference
[1] Analogy. Wikipedia, Mar 2018. 1
[2] M. Everingham, L. Van Gool, C. K. Williams, J. Winn, and A. Zisserman. The pascal visual object classes (voc) challenge. International journal of computer vision, 88(2):303– 338, 2010. 6
[3] C.-Y. Fu, W. Liu, A. Ranga, A. Tyagi, and A. C. Berg. Dssd: Deconvolutional single shot detector. arXiv preprint arXiv:1701.06659 , 2017. 3
[4] D. Gordon, A. Kembhavi, M. Rastegari, J. Redmon, D. Fox, andA.Farhadi . Iqa: Visualquestionansweringininteractive environments. arXiv preprint arXiv:1712.03316 , 2017. 1