zabbix_ When there are too many hosts on the server side, because the server side has to go to the client to collect data, ZABBIX will have serious performance problems
1. zabbix server web operation will be very stuck when the controlled side reaches a volume, easy to appear 502.
2. Layer breakage.
3. open too many processes, even if the number of items to reduce the number of machines to join a certain amount of problems later, so you can put the following two directions optimization considerations.
   Add proxy node or node mode to do distributed monitoring.
   Adjust Agentd to active mode.
Since the first option requires adding physical machines, try to use the second method to do the experiment.
1、 ZABBIX at the controlled end_ agentd.conf Profile adjustment
[root@iZ2ze275oaub8pm0zy4g6eZ ~]# egrep -v "^#|^$" /etc/zabbix/zabbix_agentd.conf
PidFile=/var/run/zabbix/zabbix_agentd.pid
LogFile=/var/log/zabbix/zabbix_agentd.log
LogFileSize=0
 StartAgents=0               #Client agent mode, set to 0 to turn off passive and turn on active mode.
#Server=101.172.288.60 #This directive should be commented out if it is set to pure active mode.
ServerActive=101.172.288.60 ##server ip address to turn on active mode
Hostname=test_host ##important: hostname of the client, not configured to use hostname by default
 RefreshActiveChecks=120 ## The period for the controlled end to get monitoring items from the server, default 120s is enough
 BufferSize=200 #The size of space to store monitoring information on the controlled side
 Timeout=10 #Timeout time
Include=/etc/zabbix/zabbix_agentd.d/

#Note: Since zabbix_agentd on the controlled side does not listen to the local port, you cannot use netstat -lnupt to find out the port.
ZABBIX agent in pure active mode can only support monitoring items of ZABBIX agent (active) type. Next, we will adjust the monitoring items.
2、 Adjust monitoring template
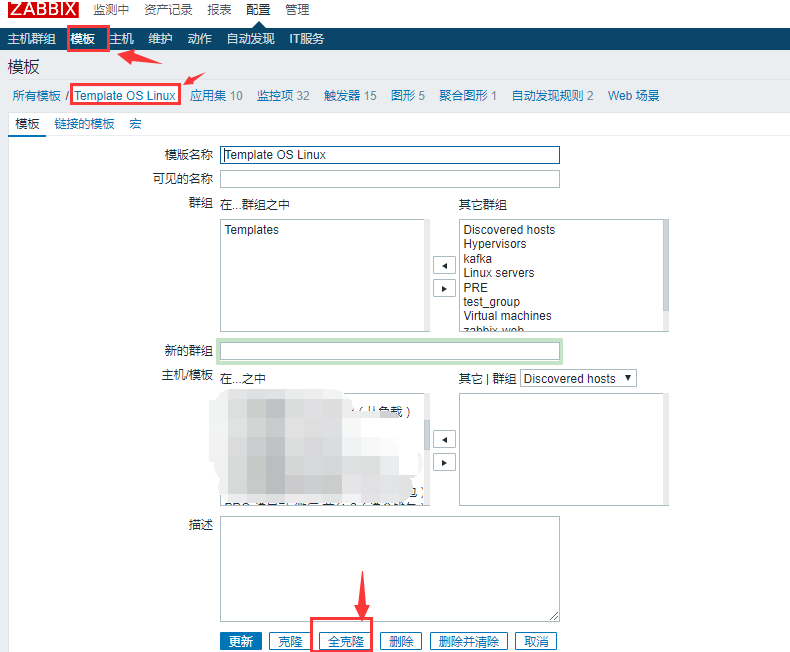
It is recommended to clone a template OS Linux template to modify it
1, clone template
2
Click the template OS Linux template name, and then click full clone below.
2. Change the template name and add the template
2
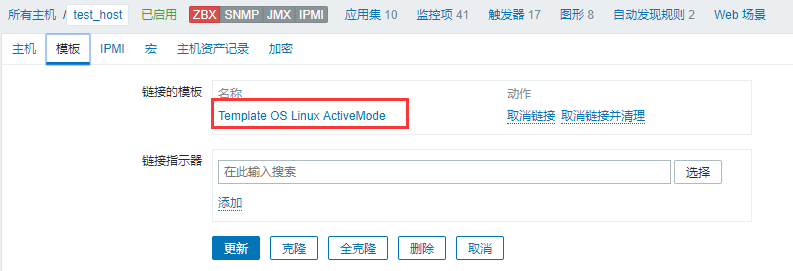
3. Add link template
4, batch update monitoring items
4
Enter the template list, find the template you just added, and click the monitoring item.
Then select all monitoring items and find the batch update at the bottom
Then check the first “type” and select “ZABBIX client (active)”; finally, click “update” below.
5. Update monitoring items of auto discovery rule
Follow the above steps to change the automatically discovered monitor type to “active”
3、 Add host
1. Configure host
2. Add link template
Add the template you just configured
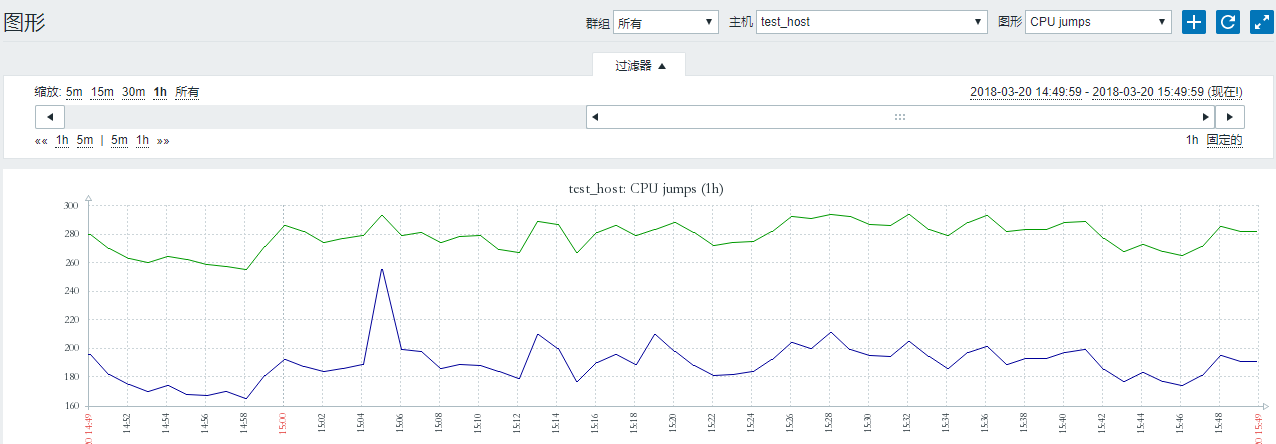
4、 Test data
Because the server is based on passive mode, if the server cannot directly connect to the passive mode port of the client, the light will not be on.
At that time, we could still get the data, so we couldn’t look at it in a passive way.