Tag Archives: zabbix

Handling of common errors reported by ZABBIX

① Error reporting:

zabbix_agentd [20529]: cannot create Semaphore: [28] No space left on device

zabbix_agentd [20529]: unable to create mutex for log file

After installing the agent in CentOS 6.5, it is found that the agent cannot be started. The errors in the log are as follows:

zabbix_agentd [20529]: cannot create Semaphore: [28] No space left on device

zabbix_agentd [20529]: unable to create mutex for log file

Modify/etc/sysctl.conf

Add the following line:

kernel.sem = 500         sixty-four thousand   sixty-four       two hundred and fifty-six

After modification, execute sysctl – P to make it effective.

Just restart ZABBIX agent

② Error reporting: no route to host processing

Configure ZABBIX on the client today_After agentd, register with ZABBIX automatically_On the server page, click the host list, but you find that ZBx displays red and cannot be monitored. The error message is:

no route to host

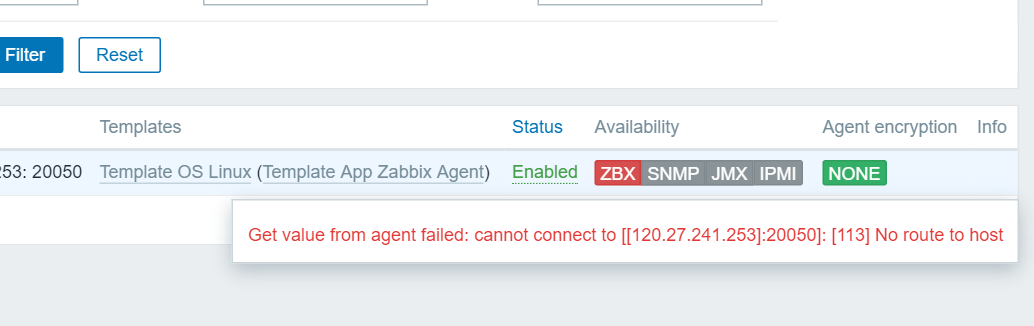
no problem is found on port 10051 of the telnet server of the client, An error is reported on the server telnet client 10050 port:
telnet 1.1.1 10050
trying 1.1.1.1…
telnet: connect to address 120.27.241.253: no route to host

it was originally lost by the client’s firewall file. Close the client’s firewall or configure the corresponding rules

③ Installation error:

Error Downloading Packages:
  zabbix-agent-1.8.22-1.el6.x86_64: Insufficient space in download directory /var/cache/yum/x86_64/6/epel/packages
    * free   0  
    * needed 131 k
  zabbix-1.8.22-1.el6.x86_64: Insufficient space in download directory /var/cache/yum/x86_64/6/epel/packages
    * free   0  
    * needed 93 k

Reason:

Insufficient disk space, failed

If the DF – LH command finds that the disk is full, delete some logs

④ Zookeeper does not plot

View log/var/log/ZABBIX/ZABBIX_Agentd.log, a large number of errors

1404:20161225:183259.913 active check configuration update from [1.1.1.1:10051] started to fail (ZBX_TCP_READ() timed out)

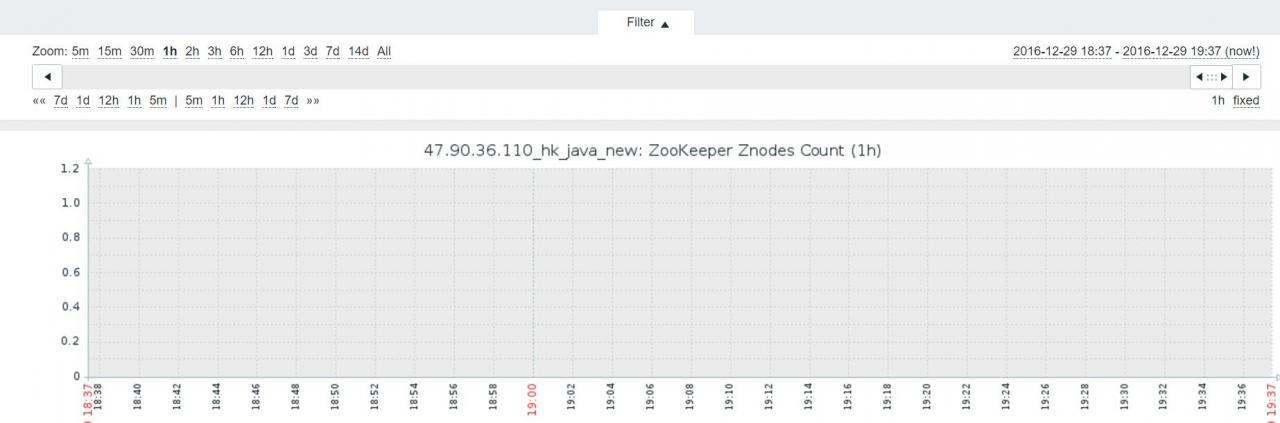
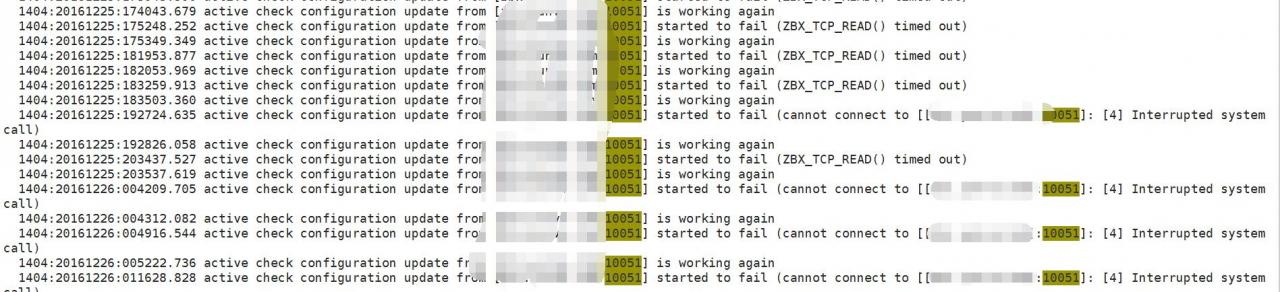
It was ZABBIX_The sender needs to actively send data to the server, but the 10051 port on the ZABBIX server side is blocked by the firewall. The problem of re releasing the port is solved

Zabbix Warning: Too many processes on zabbix server

zabbix alarmsToo many processes on zabbix server


zabbix has a lot of alarms, too many running processes, but some machines can actually ignore them and need to turn off the related alarms

Configuration–>Templates find Template_Linux click on the line Triggers select

Lack of free memory on server {HOSTNAME}
Too many processes on {HOSTNAME}

Modify the corresponding alarm value, or simply disable

Host:dev.test_server
Trigger: Too many processes on dev.test_server
Trigger status: PROBLEM
Trigger severity: Warning
Trigger URL:

Item values:

1. Number of processes (dev.test_server:proc.num[]): 310
2. *UNKNOWN* (*UNKNOWN*:*UNKNOWN*): *UNKNOWN*
3. *UNKNOWN* (*UNKNOWN*:*UNKNOWN*): *UNKNOWN*

Original event ID: 1277416

Zabbix agent on Zabbix server is unreachable for 5 minutes

Zabbix agent on Zabbix server is unreachable for 5 minutes

When the host is running, this error will be reported, so first press install ZABBIX agent

In the process of monitoring, ZABBIX server found that the web reported an error, indicating that the connection between ZABBIX server and agent has been lost for more than 5 minutes. In order to find the root cause of the problem, when troubleshooting, you should first check the log corresponding to the service. First of all, you should check the log of the server to see if there are any error messages. Through the log check, you can find that the server is running normally. Then the problem is likely to appear on the client. Go to this agent to check the service log.

1. View log

[root@iZbp11rfoyeescusr9ha9qZ tmp]# find/-name *agentd.log

/var/log/zabbix/zabbix_agentd.log

[root@iZbp11rfoyeescusr9ha9qZ tmp]# vim /var/log/zabbix/zabbix_agentd.log

23904:20170310:092458.633 Starting Zabbix Agent [Zabbix server]. Zabbix 2.2.16 (revision 64243).

23904:20170310:092458.634 using configuration file: /etc/zabbix_agentd.conf

23915:20170310:092458.636 agent #1 started [listener #1]

23918:20170310:092458.636 agent #3 started [listener #3]

23917:20170310:092458.636 agent #2 started [listener #2]

23914:20170310:092458.636 agent #0 started [collector]

23919:20170310:092458.637 agent #4 started [active checks #1]

23919:20170310:092458.637 active check configuration update from [127.0.0.1:10051] started to fail (cannot connect to [[127.0.0.1]:10051]: [111] Connection refused)

23919:20170310:102358.983 active check configuration update from [127.0.0.1:10051] is working again

23919:20170310:102358.983 no active checks on server [127.0.0.1:10051]: host [Zabbix server] not monitored

23919:20170310:102559.020 no active checks on server [127.0.0.1:10051]: host [Zabbix server] not monitored

23919:20170310:102759.073 no active checks on server [127.0.0.1:10051]: host [Zabbix server] not monitored

23919:20170310:102959.109 no active checks on server [127.0.0.1:10051]: host [Zabbix server] not monitored

23904:20170310:103011.545 Got signal [signal:15(SIGTERM),sender_pid:26144,sender_uid:0,reason:0]. Exiting ...

23904:20170310:103011.547 Zabbix Agent stopped. Zabbix 2.2.16 (revision 64243).

26157:20170310:103011.659 Starting Zabbix Agent [Zabbix server]. Zabbix 2.2.16 (revision 64243).

26157:20170310:103011.659 using configuration file: /etc/zabbix_agentd.conf

26168:20170310:103011.663 agent #1 started [listener #1]

26172:20170310:103011.663 agent #4 started [active checks #1]

26171:20170310:103011.663 agent #3 started [listener #3]

26170:20170310:103011.663 agent #2 started [listener #2]

26166:20170310:103011.664 agent #0 started [collector]

26172:20170310:103011.667 no active checks on server [127.0.0.1:10051]: host [Zabbix server] not monitored

By checking the logs, we found 23919:20170310:092458.637 This log entry tells us that the active check for configuration updates from [127.0.0.1:10051] failed and the connection between agent and server failed.

2. Modify the agent’s configuration file to change the address of ServerActive to the IP address of zabbix-server

[ root@iZbp11rfoyeescusr9ha9qZ tmp]# vim /etc/zabbix/zabbix_ agentd.conf

122 ServerActive=121.43.161.35

3. Restart ZABBIX agent service to make the configuration effective

[ root@iZbp11rfoyeescusr9ha9qZ tmp]# /etc/init.d/zabbix-agentd restart

Shutting down Zabbix agent: [ OK ]

Starting Zabbix agent: [ OK ]

4. The browser refreshes the page and finds that the server has re monitored the data of the agent’s running status

Tips:When troubleshooting, you can focus on the failure keywords such as “fail” or “error”, so that you can quickly debug and find the cause of the problem, without having to read all the logs, which greatly improves the efficiency.

As an operation and maintenance engineer, the information stored in his head may be too much and miscellaneous. Sometimes he forgets the absolute path of a service or configuration file. If he remembers the complete name of the file or directory, he can use the “locate + file name” command to locate the absolute path of the file. If he can’t remember the file name clearly, it doesn’t matter. He can also use the powerful search engine of Linux platform For example, you can find the path of the file you want through the asterisk/- find* agentd.conf (start with the/directory and globally search for. Conf files that end with agentd). These are the basic skills that an operation and maintenance engineer should have, without having to memorize the absolute path of all files by rote.

ZABBIX agent active mode monitoring

zabbix_ When there are too many hosts on the server side, because the server side has to go to the client to collect data, ZABBIX will have serious performance problems

1. zabbix server web operation will be very stuck when the controlled side reaches a volume, easy to appear 502.
2. Layer breakage.
3. open too many processes, even if the number of items to reduce the number of machines to join a certain amount of problems later, so you can put the following two directions optimization considerations.
   Add proxy node or node mode to do distributed monitoring.
   Adjust Agentd to active mode.
Since the first option requires adding physical machines, try to use the second method to do the experiment.

1、 ZABBIX at the controlled end_ agentd.conf Profile adjustment

[root@iZ2ze275oaub8pm0zy4g6eZ ~]# egrep -v "^#|^$" /etc/zabbix/zabbix_agentd.conf 
PidFile=/var/run/zabbix/zabbix_agentd.pid
LogFile=/var/log/zabbix/zabbix_agentd.log
LogFileSize=0
 StartAgents=0               #Client agent mode, set to 0 to turn off passive and turn on active mode.
#Server=101.172.288.60 #This directive should be commented out if it is set to pure active mode.
ServerActive=101.172.288.60 ##server ip address to turn on active mode
Hostname=test_host ##important: hostname of the client, not configured to use hostname by default
 RefreshActiveChecks=120 ## The period for the controlled end to get monitoring items from the server, default 120s is enough
 BufferSize=200 #The size of space to store monitoring information on the controlled side
 Timeout=10 #Timeout time
Include=/etc/zabbix/zabbix_agentd.d/

#Note: Since zabbix_agentd on the controlled side does not listen to the local port, you cannot use netstat -lnupt to find out the port.

ZABBIX agent in pure active mode can only support monitoring items of ZABBIX agent (active) type. Next, we will adjust the monitoring items.

2、 Adjust monitoring template

It is recommended to clone a template OS Linux template to modify it

1, clone template

2

Click the template OS Linux template name, and then click full clone below.

2. Change the template name and add the template

2


3. Add link template


4, batch update monitoring items

4

Enter the template list, find the template you just added, and click the monitoring item.


Then select all monitoring items and find the batch update at the bottom

Then check the first “type” and select “ZABBIX client (active)”; finally, click “update” below.


5. Update monitoring items of auto discovery rule

Follow the above steps to change the automatically discovered monitor type to “active”


3、 Add host

1. Configure host

2. Add link template

Add the template you just configured

4、 Test data

Because the server is based on passive mode, if the server cannot directly connect to the passive mode port of the client, the light will not be on.

At that time, we could still get the data, so we couldn’t look at it in a passive way.

Solve the problem of “ZABBIX discoverer processes 75% busy” in CentOS

Solve the problem of “ZABBIX discoverer processes 75% busy” in CentOS

Pioneers published in operation and maintenance experience sharing subscription

253

Tencent cloud server annual payment 3 fold

The first purchase of cloud server is at least 3 fold, with super high cost performance

Limited time rush purchase

In the process of using ZABBIX, when the auto discovery protocol is turned on, the alarm message “ZABBIX discoverer processes more than 75% busy” frequently appears, as follows:

Trigger: Zabbix discoverer processes more than 75% busy
Trigger status: PROBLEM
Trigger severity: Average
Trigger IP: 61.172.253.59
Item values:
1. Zabbix busy discoverer processes, in % (192.168.1.222:zabbix[process,discoverer,avg,busy]): 100 %
Original event ID: 4690

After searching on the Internet, there are many main reasons for the alarm: 1. MySQL supporting ZABBIX is stuck; 2. Io of ZABBIX server is stuck; 3. ZABBIX process is not allocated enough memory; 4. The target server is not connected to the network. Therefore, consider increasing the number of initialization processes when ZABBIX server starts, and directly increasing the polling load to avoid this kind of error. Modify/etc/ZABBIX/ZABBIX_ server.conf , find startpollers


### Option: StartPollers

# Number of pre-forked instances of pollers.

#

# Mandatory: no

# Range: 0-1000

# Default:

StartPollers=5

According to the system hardware configuration, it can be set to a higher value. Another solution is to restart ZABBIX server regularly. It can be configured by timing script as follows:


crontab -e

@daily service zabbix-server restart &> /dev/null 2&>&1

For reprint, please note: knowledge base solves the problem of “ZABBIX discoverer processes 75% busy” in CentOS

(adsbygoogle = window.adsbygoogle || []).push({});

ZABBIX monitoring port

Using ZABBIX’s own key to monitor process and port

Every company has its own program, its own process name and port monitoring. For Nagios, it often needs to write plug-ins, but ZABBIX does not. It has its own key to monitor the process and port.

Before using ZABBIX’s key to monitor the process and port, I also wrote a plug-in myself, but it’s very uncomfortable to use, because it needs to be configured and maintained on all agents. If you use ZABBIX’s own function, you only need to maintain it on the server side. It’s just the difference between being very attentive and being distracted. Why didn’t I find this function earlier.

Let’s get down to business

1, monitoring port

2

The monitoring port uses the following key:

key: net.tcp.listen [port]

Checks if this port is in LISTEN state. 0 – it is not, 1 – it is inLISTEN state.

Listening to the port status, if the return result is 1, it will run; if the return result is 0, it will not run.

For example, monitoring port 443, net.tcp.listen [443]

2, monitoring process

2

If a process does not have a listening port, the following key can be used.

key: proc.num [<name&>,<user&>,<state&>,<cmdline&>]

Number of processes. <name&> and <user&> same as inproc.mem item. <state&> all (default), run, sleep, zomb. <cmdline&>filter by command line (supports regex).

Name: is the process name

User: the user who runs the process

State: the process state includes run, sleep and zomb

CmdLine: the content of this item is a fuzzy match, that is, if the last column seen with PS aux contains this field, it will be matched.

Note: the name matching may not be very accurate. Generally, the process is matched according to the CmdLine

For example, monitoring cond, proc.num [,root,all,crond]

The configuration is as follows:

3, trigger configuration

3

For port monitoring, if it is normal, the return value is 1; for process monitoring, if it is normal, the return value is &> = 1; if the return result is 0, the process is down.

For example, the trigger configuration for port 443 is as follows:

If the last two results are equal to 0, the alarm will be given. The trigger configuration for a process is the same.

ZABBIX is very convenient for monitoring the process and port survival status. Recently, I’m learning ZABBIX by myself. I’m exploring more useful functions. Welcome to leave a message.

Zabbix unreachable poller processes more than 75% busy

“ZABBIX poller processes more than 75% busy” alert problem solved

Although there are various monitoring alarms in ZABBIX, the most frequently encountered ones are memory exhaustion, network congestion, IO slow and “ZABBIX poller processes more than 75% busy”. At the beginning, I didn’t care much because it didn’t affect the use and lasted for a while. With the increase of the database, ZABBIX consumes more and more memory. Poller processes are busy every day, and finally ZABBIX has to be moved to another server.

But this has not completely solved the problem, and the alarm is still coming for several days. When the email function of ZABBIX alert is turned on, this kind of email is frequently received. There are many problems causing busy polling. It is possible that MySQL supporting ZABBIX is stuck, io of ZABBIX server is stuck, and ZABBIX process is not enough to allocate memory. A simple way is to increase the number of processes initialized at the start of ZABBIX server, which directly increases the polling load and proportionally reduces the busy situation.

The method of adding initialization process is very simple. Edit the configuration file/ZABBIX of ZABBIX server_ server.conf , find the paragraph to configure startpollers:

one

two

three

four

five

six

seven

### Option: StartPollers

# Number of pre-forked instances of pollers.

#

# Mandatory: no

# Range: 0-1000

# Default:

# StartPollers=5

Cancel the comment of “startpollers = line” or add it directly after:

one

StartPollers=10

How many startpollers are changed depends on the performance of the server and the number of monitors. Kaijia did not encounter any alerts after setting startpollers to 12. If there is enough memory, it can be set higher. Run after setup:

one

servicezabbix-serverrestart

Restart ZABBIX. Of course, another way to reduce the load of ZABBIX server as a whole is to restart ZABBIX regularly. This method can be implemented with cron

one

crontab-e

Add a plan in the cron editor:

one

@dailyservicezabbix-serverrestart&>/dev/null2&>&1

This plan will automatically restart ZABBIX service every day to end the zombie process and clean up memory. At present, Kaijia has not encountered the problem of “ZABBIX poller processes more than 75% busy” again after configuring ZABBIX in this way.

or/ZABBIX_ server.conf

Most likely, you have this setting:
startdiscoverers = 1 can also become larger
continue to increase the number of instances discovered by pre forced.

If you decide not to use the discovery function, you can set the parameters:
startdiscoverers = 0

ZBx appears in ZABBIX custom key_ NOTSUPPORTED: Unsupported item key.

ZBx appears in ZABBIX custom key_ NOTSUPPORTED: Unsupported item key.

Category: Linux

2016-04-26 16:03:02

I haven’t done much ZABBIX before. In recent days, I have to monitor the master and slave of MySQL according to
basic rules http://www.linuxidc.com/Linux/2012-10/72552.htm
This can be done, but the client is ready. After restarting the service, the server can’t get the key, and the prompt is ZBx_ Notsupported: Unsupported item key.

all kinds of queries, close SELinux, release port through firewall, telnet client 10050 is connected, change agentd. After the configuration of

allowroot = 1
enable remote commands = 1
unsafeuserparameters = 1
, the service can not be restarted.
A little confused….

then it is found that the process started by the client is not listening to port 10050, so it can start the service directly by pkill – F ZABBIX
this time…

the article with the link address is below

Recently, we built a ZABBIX monitoring system in our company. Now we need to use ZABBIX to monitor the master-slave synchronization of MySQL

Now let’s talk about the detailed steps of configuration

1. First, assign a monitoring account to MySQL

mysql&> grant replication client on *.* to ‘zabbix’@’localhost’;

2. Write a script

Let’s carry out an order first

mysql -u zabbix -e ‘show slave status\G’

We choose from the output information

Slave_ IO_ Running: Yes

Slave_ SQL_ Running: Yes

These two are monitored

I tested it. When the operation data is abnormal, slave_ SQL_ Running will become No

When the slave stop is executed, both will become No

The script is as follows

#!/bin/bash
/usr/local/mysql/bin/mysql -uzabbix -e ‘show slave status\G’ |grep -E “Slave_ IO_ Running|Slave_ SQL_ Running”|awk ‘{print $2}’|grep -c Yes

I just wrote an order, and I’ll explain it

First, use ZABBIX to get all the states of the slave, then grep the two states, and then output the second column. Finally, check several yes states

Normally, there are two yes states

In fact, you will find that there is only one command, but I have written it into a script. Here I say, because if you write the command into the configuration file, you have to restart the agent after each modification, so it is more convenient to debug and modify it in the script. This should be a good habit.

3. Add monitoring items in agent

Add the following line at the end of the file

UserParameter= mysql.replication ,/home/zabbix/mysql- replication.sh

In the string after the equal sign, the comma is preceded by the key, followed by the script to be executed

After adding, restart the agent program

4. Add monitoring items on server

Go to the ZABBIX installation directory, and mine is/usr/local/ZABBIX/bin

Implementation./ZABBIX_ get -s 192.168.177.185 -k ” mysql.replication “

192.168.177.185 here is the IP address of my agent

If the master-slave copy is normal, 2 will be returned (indicating that both states are yes)

Now the server can get the status from the agent.

Now add monitoring items in the management interface

System configuration – Host – select the monitoring items of the host to be monitored

In the upper right corner, select Create item

Note that the key here is the key filled in the agent configuration file, and the data type should also be numeric

The data update interval can be set according to your own needs. After creation, you can save it

Create trigger again

Enter the trigger and click create trigger

You can fill in the name here. The warning degree is disaster

Then there is the expression. After clicking the hyperlink, select the “Edit” button

In the pop-up connection, click search after item and select the monitoring item just created

There are some rules in function. We choose last value

We set n to 2, that is, if it is less than 2 yes, the alarm will be given, and the rest will be ignored.

After setting, don’t forget to click the “add” button.

Finally, click save.

It’s configured here. At this time

At this time, we stop the replication process of MySQL, wait a moment, open the monitoring interface of ZABBIX, and select “status statistics” and “dashboard”

You can see the alarm.

We can also set the SMS alarm again, which will not be detailed here.