After five months (click to read the previous article), the problem as shown in the title occurs again. Due to the improvement of our big data monitoring system, I have made a further study on this problem. The following is the whole investigation process and solution:
1、 Problem description
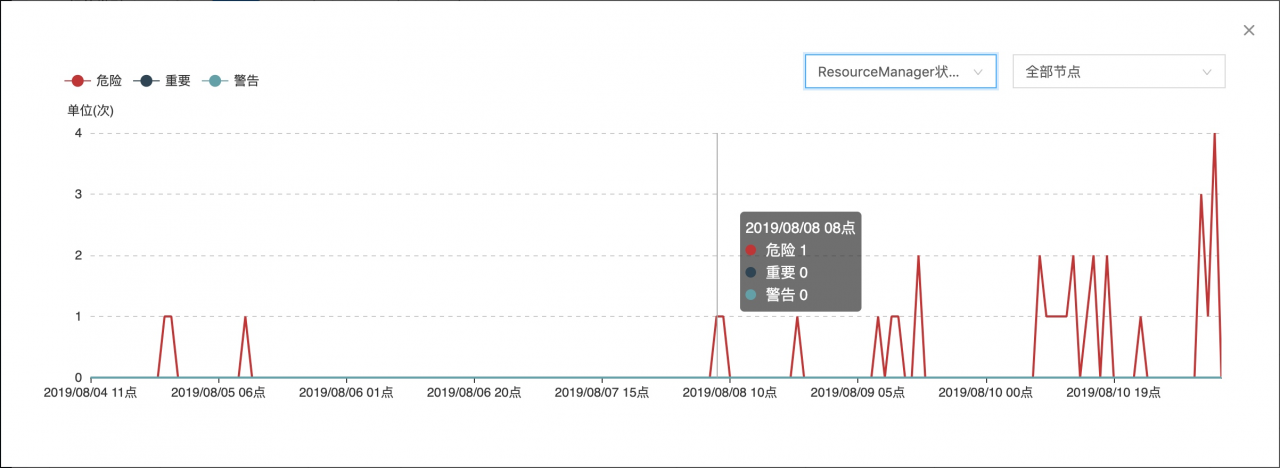
The first ResourceManager service exception alarm was received from 8:12 a.m. on August 8. As of 8:00 a.m. on August 11, the ResourceManager service exception problem frequently occurred between 8:00 a.m. and 8:12 a.m. every day, and occasionally occurred at 8:00 p.m. and 1-3 p.m. every day. The following is the statistics of ResourceManager abnormal status times by SpaceX :
2、 Abnormal causes
1. Abnormal information
The following interception is the log between 20:00 and 20:12 on August 8 , and the exception information in other periods is the same as this information:
2019-08-08 20:12:18,681 INFO org.apache.hadoop.yarn.server.resourcemanager.recovery.ZKRMStateStore: Retrying operation on ZK. Retry no. 544
2019-08-08 20:12:18,886 INFO org.apache.zookeeper.ClientCnxn: Opening socket connection to server 10.204.245.44/10.204.245.44:5181. Will not attempt to authenticate using SASL (unknown error)
2019-08-08 20:12:18,887 INFO org.apache.zookeeper.ClientCnxn: Socket connection established to 10.204.245.44/10.204.245.44:5181, initiating session
2019-08-08 20:12:18,887 INFO org.apache.zookeeper.ClientCnxn: Session establishment complete on server 10.204.245.44/10.204.245.44:5181, sessionid = 0x26c00dfd48e9068, negotiated timeout = 60000
2019-08-08 20:12:20,850 WARN org.apache.zookeeper.ClientCnxn: Session 0x26c00dfd48e9068 for server 10.204.245.44/10.204.245.44:5181, unexpected error, closing socket connection and attempting reconnect
java.lang.OutOfMemoryError: Java heap space
2019-08-08 20:12:20,951 INFO org.apache.hadoop.yarn.server.resourcemanager.recovery.ZKRMStateStore: Exception while executing a ZK operation.
org.apache.zookeeper.KeeperException$ConnectionLossException: KeeperErrorCode = ConnectionLoss
	at org.apache.zookeeper.KeeperException.create(KeeperException.java:99)
	at org.apache.zookeeper.ZooKeeper.multiInternal(ZooKeeper.java:935)
	at org.apache.zookeeper.ZooKeeper.multi(ZooKeeper.java:915)
	at org.apache.hadoop.yarn.server.resourcemanager.recovery.ZKRMStateStore$5.run(ZKRMStateStore.java:989)
	at org.apache.hadoop.yarn.server.resourcemanager.recovery.ZKRMStateStore$5.run(ZKRMStateStore.java:986)
	at org.apache.hadoop.yarn.server.resourcemanager.recovery.ZKRMStateStore$ZKAction.runWithCheck(ZKRMStateStore.java:1128)
	at org.apache.hadoop.yarn.server.resourcemanager.recovery.ZKRMStateStore$ZKAction.runWithRetries(ZKRMStateStore.java:1161)
	at org.apache.hadoop.yarn.server.resourcemanager.recovery.ZKRMStateStore.doMultiWithRetries(ZKRMStateStore.java:986)
	at org.apache.hadoop.yarn.server.resourcemanager.recovery.ZKRMStateStore.doMultiWithRetries(ZKRMStateStore.java:1000)
	at org.apache.hadoop.yarn.server.resourcemanager.recovery.ZKRMStateStore.setDataWithRetries(ZKRMStateStore.java:1017)
	at org.apache.hadoop.yarn.server.resourcemanager.recovery.ZKRMStateStore.updateApplicationAttemptStateInternal(ZKRMStateStore.java:713)
	at org.apache.hadoop.yarn.server.resourcemanager.recovery.RMStateStore$UpdateAppAttemptTransition.transition(RMStateStore.java:243)
	at org.apache.hadoop.yarn.server.resourcemanager.recovery.RMStateStore$UpdateAppAttemptTransition.transition(RMStateStore.java:226)
	at org.apache.hadoop.yarn.state.StateMachineFactory$SingleInternalArc.doTransition(StateMachineFactory.java:362)
	at org.apache.hadoop.yarn.state.StateMachineFactory.doTransition(StateMachineFactory.java:302)
	at org.apache.hadoop.yarn.state.StateMachineFactory.access$300(StateMachineFactory.java:46)
	at org.apache.hadoop.yarn.state.StateMachineFactory$InternalStateMachine.doTransition(StateMachineFactory.java:448)
	at org.apache.hadoop.yarn.server.resourcemanager.recovery.RMStateStore.handleStoreEvent(RMStateStore.java:812)
	at org.apache.hadoop.yarn.server.resourcemanager.recovery.RMStateStore$ForwardingEventHandler.handle(RMStateStore.java:872)
	at org.apache.hadoop.yarn.server.resourcemanager.recovery.RMStateStore$ForwardingEventHandler.handle(RMStateStore.java:867)
	at org.apache.hadoop.yarn.event.AsyncDispatcher.dispatch(AsyncDispatcher.java:182)
	at org.apache.hadoop.yarn.event.AsyncDispatcher$1.run(AsyncDispatcher.java:109)
	at java.lang.Thread.run(Thread.java:745)
2. Abnormal causes
The main reason is that the ZK server limits the amount of data of a single node to less than 1m . After the data submitted by the client exceeds 1m , the ZK server will throw the following exception:
Exception causing close of session 0x2690d678e98ae8b due to java.io.IOException: Len error 1788046
After the exception is thrown, yard will continue to retry the ZK , with short interval and many times of retrying, resulting in yard memory overflow and unable to provide normal service.
3. Yard exception code
The following is org.apache.hadoop . yarn.server.resourcemanager . recovery.ZKRMStateStore Method of exception code in :
   /**
     * Update Information
     *
     * @param appAttemptId
     * @param attemptStateDataPB
     * @throws Exception
     */
    @Override
    public synchronized void updateApplicationAttemptStateInternal(
            ApplicationAttemptId appAttemptId,
            ApplicationAttemptStateData attemptStateDataPB)
            throws Exception {
        String appIdStr = appAttemptId.getApplicationId().toString();
        String appAttemptIdStr = appAttemptId.toString();
        String appDirPath = getNodePath(rmAppRoot, appIdStr);
        String nodeUpdatePath = getNodePath(appDirPath, appAttemptIdStr);
        if (LOG.isDebugEnabled()) {
            LOG.debug("Storing final state info for attempt: " + appAttemptIdStr
                    + " at: " + nodeUpdatePath);
        }
        byte[] attemptStateData = attemptStateDataPB.getProto().toByteArray();

        if (existsWithRetries(nodeUpdatePath, true) != null) {
            setDataWithRetries(nodeUpdatePath, attemptStateData, -1);
        } else {
            createWithRetries(nodeUpdatePath, attemptStateData, zkAcl,
                    CreateMode.PERSISTENT);
            LOG.debug(appAttemptId + " znode didn't exist. Created a new znode to"
                    + " update the application attempt state.");
        }
    }
This code is mainly used to update or add task retrial status information to ZK , horn in the process of scheduling tasks, tasks may be retried many times, which is mainly affected by network, hardware, resources and other factors. If the task retry information fails to save ZK , the will be called org.apache.hadoop . yarn.server.resourcemanager . recovery.ZKRMStateStore.ZKAction . runwithretries method to try again. By default, the number of retries is 1000 times, and the interval between retries is affected by whether to enable yard high availability, that is, yard- site.xml in yarn.resourcemanager.ha Whether the. Enabled parameter is true . The official explanation of the retrial interval is as follows:
Retry interval in milliseconds when connecting to ZooKeeper. When HA is enabled, the value here is NOT used. It is generated automatically from yarn.resourcemanager.zk-timeout-ms and yarn.resourcemanager.zk-num-retries.
Under the condition of whether to enable horn high availability, the retrial interval mechanism is as follows:
(1) horn high availability is not enabled:
Affected by yarn.resourcemanager.zk -The default value of this parameter is 1000 in the Bi production environment, and the unit is Ms.
(2) Enable horn high availability:
Affected by yarn.resourcemanager.zk -Timeout MS ( ZK session timeout) and session timeout yarn.resourcemanager.zk -Num retries (number of retries after operation failure) parameter control, the calculation formula is:
try later(yarn.resourcemanager.zk-retry-interval-ms )=yarn.resourcemanager.zk-timeout-ms(ZK session超时时间)/yarn.resourcemanager.zk-num-retries(重试次数)
The process of determining the retrial interval is in org.apache.hadoop . yarn.server.resourcemanager . recovery.ZKRMStateStore.initInternal The method source code is:
// Calculate the time interval to retry the connection ZK, expressed in milliseconds
if (HAUtil.isHAEnabled(conf)) { // In the case of high availability: retry interval = session timeout / number of retries to ZK
    zkRetryInterval = zkSessionTimeout/numRetries;
} else {
    zkRetryInterval =
            conf.getLong(YarnConfiguration.RM_ZK_RETRY_INTERVAL_MS,
                    YarnConfiguration.DEFAULT_RM_ZK_RETRY_INTERVAL_MS);
}
Bi configuration of production environment:
yarn.resourcemanager.zk -Timeout MS : 60000 , unit: ms
yarn.resourcemanager.zk -Num retries : use the default value 1000 , unit times
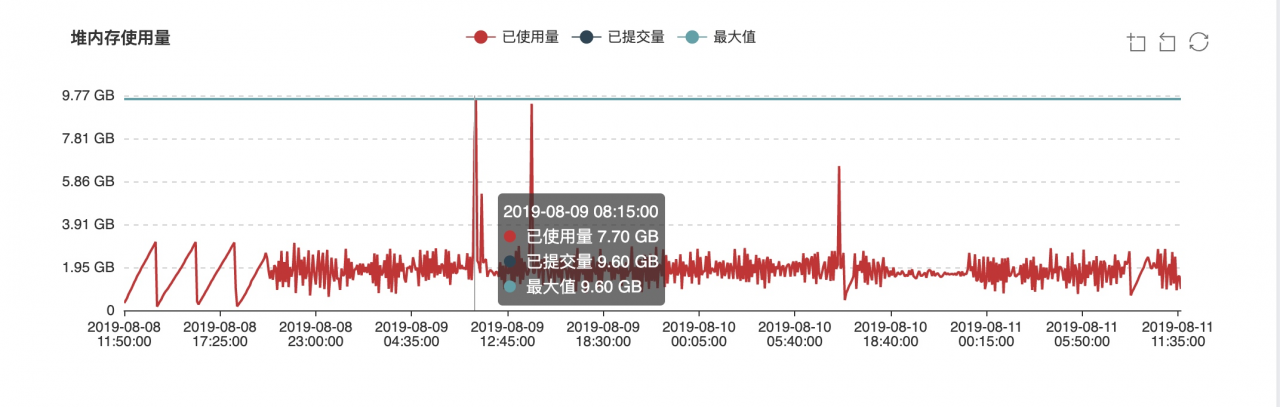
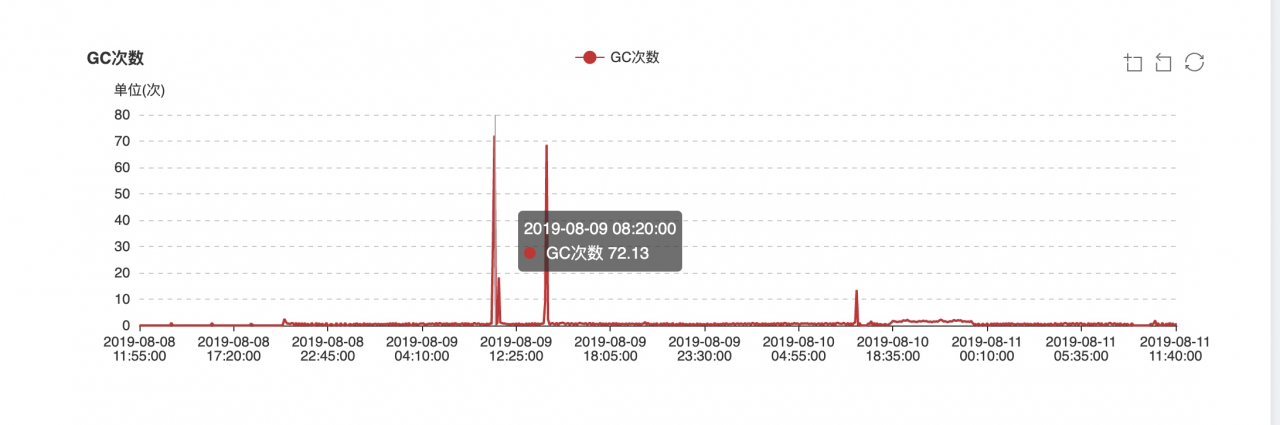
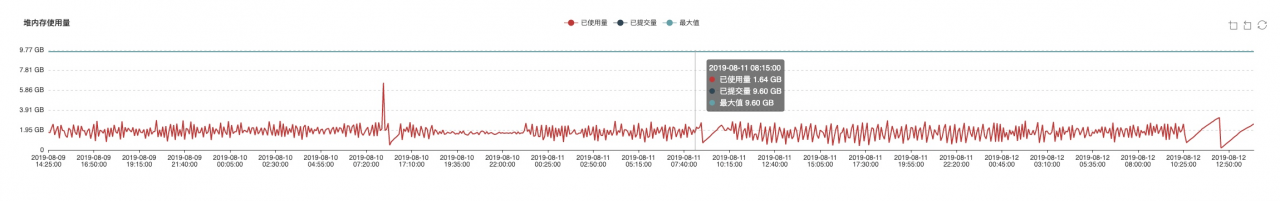
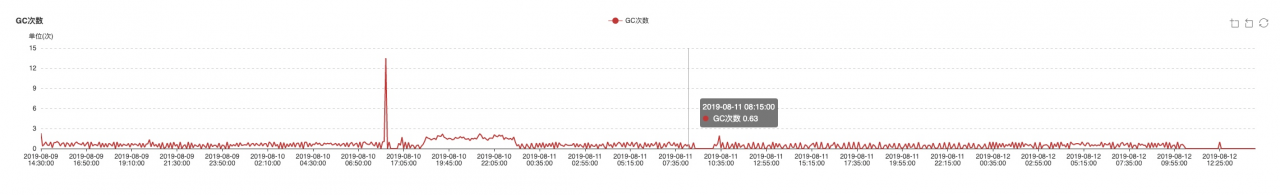
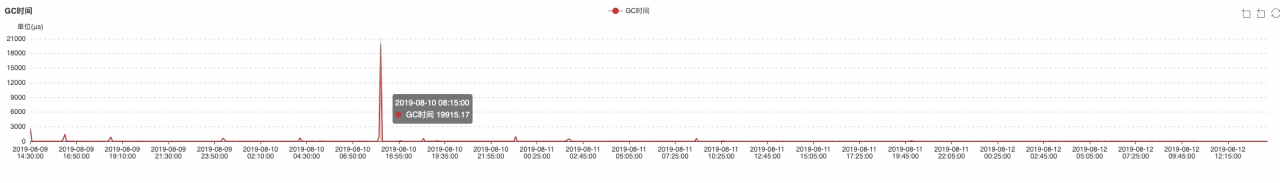
Therefore, the retrial interval of Bi production environment is 60000/1000 = 60 . If the task status is not saved successfully, it will be retried 1000 times with an interval of 60 Ms. It’s terrible, which will eventually lead to horn heap memory overflow ( 10g = 4G [Cenozoic] + 6G [old age] ). The following is the JVM monitoring data monitored by SpaceX when using the above 2 parameters to perform high frequency retrying operation:
(1) Heap memory usage:
(2) GC times:
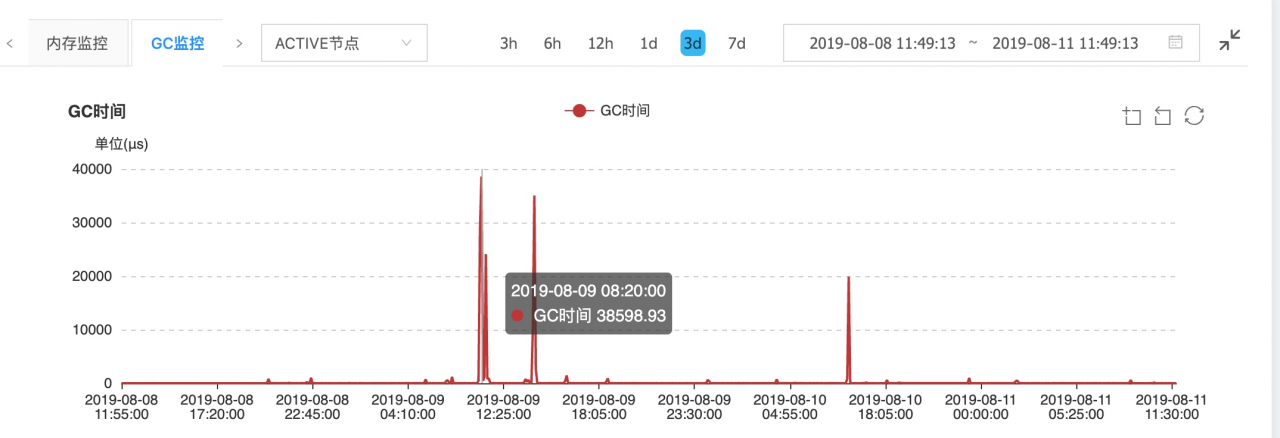
(3) full GC time:
3、 Solutions
1. Adjust the number of completed tasks saved by yard in ZK to solve the problem that yard registers too many useless watchers in ZK due to saving too much completed task information in ZK (default value is 10000 ). Major adjustments yarn.resourcemanager.state – store.max -Completed applications and yarn.resourcemanager.max -The parameters of completed applications are as follows:
<!--ZKMaximum number of completed tasks saved--&>
<property&>
  <name&>yarn.resourcemanager.state-store.max-completed-applications</name&>
  <value&>2000</value&>
</property&>

<!--The maximum number of completed tasks saved in RM memory, adjust this parameter mainly for the consistency of the information and number of tasks saved in RM memory and ZK--&>
<property&>
  <name&>yarn.resourcemanager.max-completed-applications</name&>
  <value&>2000</value&>
</property&>
Task status information saved in ZK ( RM_ APP_ The structure of root ) is as follows:
    ROOT_DIR_PATH
      |--- VERSION_INFO
      |--- EPOCH_NODE
      |--- RM_ZK_FENCING_LOCK
      |--- RM_APP_ROOT
      |     |----- (#ApplicationId1)
      |     |        |----- (#ApplicationAttemptIds)
      |     |
      |     |----- (#ApplicationId2)
      |     |       |----- (#ApplicationAttemptIds)
      |     ....
      |
      |--- RM_DT_SECRET_MANAGER_ROOT
      |----- RM_DT_SEQUENTIAL_NUMBER_ZNODE_NAME
      |----- RM_DELEGATION_TOKENS_ROOT_ZNODE_NAME
      |       |----- Token_1
      |       |----- Token_2
      |       ....
      |
      |----- RM_DT_MASTER_KEYS_ROOT_ZNODE_NAME
      |      |----- Key_1
      |      |----- Key_2
      ....
      |--- AMRMTOKEN_SECRET_MANAGER_ROOT
      |----- currentMasterKey
      |----- nextMasterKey
The data structure determines the algorithm implementation. As can be seen from the above structure, a task ID ( applicationid ) will correspond to multiple task retrial information ID ( applicationattemptid ), zkrmstatestore has registered watcher for these nodes, so too many nodes will increase the number of watchers and consume too much ZK Heap memory. Bi production environment horn running tasks every day 7000 or so. Therefore, the above two parameters are reduced to 2000 , and the adjustment will not affect the task status information at runtime. The specific reasons are as follows:
(1) From org.apache.hadoop . yarn.server.resourcemanager According to the operations related to member variables completedappsinstatestore and completedapps in. Rmappmanager class, the above two configurations save the information of completed tasks. The relevant codes are as follows:
protected int completedAppsInStateStore = 0; //Record the completed task information, task completion automatically add 1
private LinkedList<ApplicationId&> completedApps = new LinkedList<ApplicationId&>();// Record the task ID of the completed task, the task is completed and executed remove

 /**
   * Save completed task information
   * @param applicationId
   */
  protected synchronized void finishApplication(ApplicationId applicationId) {
    if (applicationId == null) {
      LOG.error("RMAppManager received completed appId of null, skipping");
    } else {
      // Inform the DelegationTokenRenewer
      if (UserGroupInformation.isSecurityEnabled()) {
        rmContext.getDelegationTokenRenewer().applicationFinished(applicationId);
      }

      completedApps.add(applicationId);
      completedAppsInStateStore++;
      writeAuditLog(applicationId);
    }
  }

  /*
   * check to see if hit the limit for max # completed apps kept
   *
   * Check if the number of completed applications stored in memory and ZK exceeds the maximum limit, and perform a remove completed task information operation if the limit is exceeded
   */
  protected synchronized void checkAppNumCompletedLimit() {
    // check apps kept in state store.
    while (completedAppsInStateStore &> this.maxCompletedAppsInStateStore) {
      ApplicationId removeId =
          completedApps.get(completedApps.size() - completedAppsInStateStore);
      RMApp removeApp = rmContext.getRMApps().get(removeId);
      LOG.info("Max number of completed apps kept in state store met:"
          + " maxCompletedAppsInStateStore = " + maxCompletedAppsInStateStore
          + ", removing app " + removeApp.getApplicationId()
          + " from state store.");
      rmContext.getStateStore().removeApplication(removeApp);
      completedAppsInStateStore--;
    }

    // check apps kept in memorty.
    while (completedApps.size() &> this.maxCompletedAppsInMemory) {
      ApplicationId removeId = completedApps.remove();
      LOG.info("Application should be expired, max number of completed apps"
          + " kept in memory met: maxCompletedAppsInMemory = "
          + this.maxCompletedAppsInMemory + ", removing app " + removeId
          + " from memory: ");
      rmContext.getRMApps().remove(removeId);
      this.applicationACLsManager.removeApplication(removeId);
    }
  }
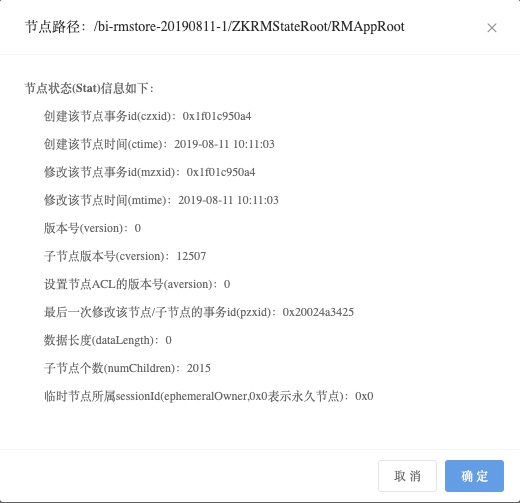
(2) Before modification, yard used the default value of 10000 for the maximum number of completed task information saved in ZK , and checked in zkdoc /bi-rmstore-20190811-1/zkrmstateroot/rmapproot in zkdoc , the number of sub nodes is 10000 + . After reducing, check the /bi-rmstore-20190811-1/zkrmstateroot/rmapproot in zkdoc to see that the number of sub nodes is 2015 , yard the real-time data of the monitoring page shows that 15 tasks were running at that time, that is to say, yard saves the status information of running tasks and completed tasks under this node . The monitoring data of zkdoc are as follows:
From this, we can conclude the mechanism of saving and removing task state in horn :
when there is a new task, yard uses the storeapplicationstateinternal method of zkrmstatestore to save the state of the new task
when more than yarn.resourcemanager.state - store.max -When the completed applications parameter is limited, yard uses the removeapplication method of rmstatestore to delete the status of completed tasks
rmstatestore is the parent class of zkrmstatestore . The synchronized keyword is added to the above two methods. The two operations are independent and do not interfere with each other, so they will not affect the tasks running in yard .
2. Solve the following problems: the retrial interval is too short, which leads to the shortage of horn heap memory and frequent GC :
<!--Default 1000, set to 100 here is to control the frequency of retry connections to ZK, in high availability case, retry frequency (yarn.resourcemanager.zk-retry-interval-ms ) = yarn.resourcemanager.zk-timeout-ms (ZK session timeout) / yarn.resourcemanager.zk-num-retries (number of retries)--&>
<property&>
  <name&>yarn.resourcemanager.zk-num-retries</name&>
  <value&>100</value&>
</property&>
After adjustment, the retrial interval of Bi production environment horn connection ZK is: 60000/100 = 600 Ms. The JVM data monitored by SpaceX is as follows:
(1) Heap memory usage:
(2) GC times:
(3) full GC time:
It can be seen from the monitoring data that when the problem occurs, the JVM heap memory usage, GC times and time consumption are improved due to the increase of the retrial interval.
3. Solve the problem that the task retrial status data exceeds 1m :
Modifying the logic related to horn will affect the task recovery mechanism of horn , so we can only modify the server configuration and client configuration of ZK to solve this problem
(1) ZK server jute.maxbuffer increase the parameter size to 3M 3M
(2) Modify yarn- env.sh , in yard_ Opts and horn_ RESOURCEMANAGER_ Opts configuration – Djute.maxbuffer=3145728 The parameter indicates that the maximum amount of data submitted by the ZK client to the ZK server is 3M . The modified configuration is as follows:
YARN_OPTS="$YARN_OPTS -Dyarn.policy.file=$YARN_POLICYFILE -Djute.maxbuffer=3145728"

YARN_RESOURCEMANAGER_OPTS="-server -Xms10240m -Xmx10240m -Xmn4048m -Xss512k -verbose:gc -Xloggc:$YARN_LOG_DIR/gc_resourcemanager.log-`date +'%Y%m%d%H%M'` -XX:+PrintGCDateStamps -XX:+PrintGCDetails -XX:SurvivorRatio=8 -XX:+UseParNewGC -XX:+UseConcMarkSweepGC -XX:CMSInitiatingOccupancyFraction=75 -XX:+UseCMSCompactAtFullCollection
-XX:CMSFullGCsBeforeCompaction=0 -XX:+CMSClassUnloadingEnabled -XX:+CMSParallelRemarkEnabled -XX:+UseCMSInitiatingOccupancyOnly -XX:+DisableExplicitGC -XX:+HeapDumpOnOutOfMemoryError -XX:HeapDumpPath=$YARN_LOG_DIR -Djute.maxbuffer=3145728 $YARN_RESOURCEMANAGER_OPTS"
After modification, restart ResourceManager service and ZK service to make the configuration effective.
4、 Summary
1. The log mechanism of Hadoop is perfect, and the whole log information is a complete event flow. Therefore, when you encounter problems, you must carefully read the log information of Hadoop to find clues.
2. At present, the ZK cluster used by yard is also used by HBase and other services. With the expansion of cluster scale and the growth of data volume, it will have a certain performance impact on ZK . Therefore, it is recommended to build a separate ZK cluster for yard instead of creating high load on ZK Use a common ZK cluster.
3. Adjusting the maximum amount of node data of ZK to 3M , will have a certain performance impact on ZK , such as cluster synchronization and request processing. Therefore, we must improve the monitoring of the basic service of ZK to ensure high availability.
5、 References
Troubleshooting of frequent change of ownership in yarn ResourceManager active
Resource manager ha application state storage and recovery
yard official issue :
(1) About issue : limit application resource reservation on nodes for non node/rack specific requests
(2) zkrmstatestore update data exceeds 1MB issue : ResourceManager failed when zkrmstatestore tries to update znode data larger than 1MB