Author Archives: Robins

[Solved] The bean ‘sysDictService’ could not be injected because it is a JDK dynamic proxy

Error Messages:

2022-11-09 11:26:21.693 ERROR 18228 --- [  restartedMain] o.s.b.d.LoggingFailureAnalysisReporter   : 

***************************
APPLICATION FAILED TO START
***************************

Description:

The bean 'sysDictService' could not be injected because it is a JDK dynamic proxy

The bean is of type 'com.sun.proxy.$Proxy134' and implements:
	org.springframework.aop.SpringProxy
	org.springframework.aop.framework.Advised
	org.springframework.cglib.proxy.Factory
	com.baomidou.mybatisplus.extension.service.IService
	org.springframework.core.DecoratingProxy

Expected a bean of type 'com.sozone.basis.dict.service.SysDictService' which implements:


Action:

Consider injecting the bean as one of its interfaces or forcing the use of CGLib-based proxies by setting proxyTargetClass=true on @EnableAsync and/or @EnableCaching.

Solution 1:

        // StartApplication.java Add this method to the project startup class
	@Bean
	@ConditionalOnMissingBean
	public DefaultAdvisorAutoProxyCreator defaultAdvisorAutoProxyCreator() {
		DefaultAdvisorAutoProxyCreator daap = new DefaultAdvisorAutoProxyCreator();
		daap.setProxyTargetClass(true);
		return daap;
	}


Solution 2:

// application.yml
spring:
  aop:
    proxy-target-class: true


Problem Description:

When sorting out the project framework, there was a sudden problem. The original framework did not have this problem. I don’t know if it was caused by a dependency. . .
Finally, use solution one to successfully solve the problem. The second solution could not be solved, and I also recorded it casually, maybe I will encounter it again later.
How to Use awk to Analyze Nginx Log

nginx log field description

127.0.0.1 – – [31/Aug/2018:16:11:16 +0800] “GET /50x.html HTTP/1.1” 200 537 “-” “curl/7.29.0”

Access ip, access time, request method, request url, response status code, response body size, ua


Statistics based on access ip

cat access.log | awk ‘{count[$1]++}END{for(ip in count){print ip,count[ip]}}’

cat access.log | awk ‘{count[$1]++}END{for(ip in count){print ip”\t”count[ip]}}’|sort -rnk 2


Count the response status codes of nginx

cat access.log|awk ‘{count[$9]++}END{for(ip in count){print ip,count[ip]}}’ #Number of status codes

cat access.log|awk ‘{count[$9]++}END{for(status in count){print status,count[status]/NR*100″%”}}’ #Proportion statistics

cat access.log|awk ‘{count[$9]++}END{for(status in count){print status”\t”int(count[status]/NR*100)”%”}}’ #proportion statistics reserved integer


According to ua statistics

cat access.log|awk -F'”‘ ‘{print $(NF-1)}’

cat access.log|awk -F'”‘ ‘{count[$(NF-1)]++}END{for(ua in count){print ua,count[ua]}}’


According to time statistics, count the number of visits per minute and the number of visits per second

cat access.log |awk ‘{print $4}’|awk -F’:’ ‘{print $1″:”$2″:”$3}’|awk ‘{count[$1]++}END{for(time in count){print time,count[time]}}’ #Count the number of requests per minute

cat access.log|awk ‘{count[$4]++}END{ for(time in count){print time,count[time]} }’ #Request per second, concurrent


nginx log filtering

cat access.log|awk ‘$9~/^2/’ #Status code, normal request

cat access.log|awk ‘$9~/^5/’ #Status code, handle exception

cat access.log |awk -F'”‘ ‘$(NF-1) ~ /iPhone/’ #Filter ua containing iphone

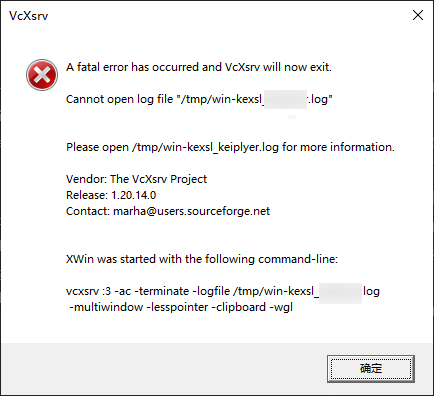
[Solved] Win-KeX/wsl2/kali Startup Error: A fatal error has occurred and VcXsrv will now exit.

image

A fatal error has occurred and VcXsrv will now exit.
Cannot open log file "/tmp/win-kexsl_******.log"
Please open /tmp/win-kexsl_keiplyer.log for more information.
Vendor: The VcXsrv Project
Release: 1.20.14.0
Contact: [email protected]
XWin was started with the following command-line:
vcxsrv :3 -ac -terminate -logfile /tmp/win-kexsl_******.log
-multiwindow -lesspointer -clipboard -wgl

Use sudo mode
sudo kex --sl --wtstart -s

[Solved] samtools: error while loading shared libraries: libcrypto.so.1.0.0: cannot open shared object file

This problem suddenly appeared when I used samtools today:

copy code
samtools: error while loading shared libraries: libcrypto.so. 1.0 . 0 : cannot open shared object  file

At first, I thought that there was a problem with the conda environment, so I executed:

copy code
conda install anaconda
conda update --all

But it did not solve the problem, so I carefully read the error and found that there may be a problem with libcrypto, and finally solved the problem!

process:

copy code
# Find the location of
 samtools which samtools

My samtools directory: /root/anaconda3/bin/samtools

Enter lib, check if there is libcrypto.so.1.1, and establish a soft connection:

copy code
# enter lib
cd /root/anaconda3/ lib
 ls

# Establish soft connection
ln -s libcrypto.so.1.1 libcrypto.so.1.0.0 _ _ _

problem solved!

k8s Error: [ERROR FileAvailable–etc-kubernetes-kubelet.conf]: /etc/kubernetes/kubelet.conf already exists

Error log:

[preflight] Running pre-flight checks
error execution phase preflight: [preflight] Some fatal errors occurred:
    [ERROR FileAvailable--etc-kubernetes-kubelet.conf]: /etc/kubernetes/kubelet.conf already exists
    [ERROR FileAvailable--etc-kubernetes-pki-ca.crt]: /etc/kubernetes/pki/ca.crt already exists
[preflight] If you know what you are doing, you can make a check non-fatal with `--ignore-preflight-errors=...`

The reason is: some configuration files and services already exist
Solution:

#reset kubeadm 
kubeadm reset

After running the kubeadm join command

or

Cause: There are residual files
Solution: (works)

#Delete k8s configuration file and certificate file
rm -rf /etc/kubernetes/kubelet.conf /etc/kubernetes/pki/ca.crt #Delete k8s configuration file and certificate file
# 
kubeadm join 192.168.191.133:6443 --token xvnp3x.pl6i8ikcdoixkaf0 \
    --discovery-token-ca-cert-hash sha256:9f90161043001c0c75fac7d61590734f844ee507526e948f3647d7b9cfc1362d

[Solved] NoSuchMethodError: org.springframework.boot.web.servlet.error.ErrorController.getErrorPath

In the process of using zuul, start the application and call the interface and report an error:

java.lang.NoSuchMethodError: org.springframework.boot.web.servlet.error.ErrorController.getErrorPath()Ljava/lang/String;
	at org.springframework.cloud.netflix.zuul.web.ZuulHandlerMapping.lookupHandler(ZuulHandlerMapping.java:87) ~[spring-cloud-netflix-zuul-2.2.7.RELEASE.jar:2.2.7.RELEASE]
	at org.springframework.web.servlet.handler.AbstractUrlHandlerMapping.getHandlerInternal(AbstractUrlHandlerMapping.java:152) ~[spring-webmvc-5.3.10.jar:5.3.10]
	at org.springframework.web.servlet.handler.AbstractHandlerMapping.getHandler(AbstractHandlerMapping.java:498) ~[spring-webmvc-5.3.10.jar:5.3.10]
	at org.springframework.web.servlet.DispatcherServlet.getHandler(DispatcherServlet.java:1261) ~[spring-webmvc-5.3.10.jar:5.3.10]
	at org.springframework.web.servlet.DispatcherServlet.doDispatch(DispatcherServlet.java:1043) ~[spring-webmvc-5.3.10.jar:5.3.10]
	at org.springframework.web.servlet.DispatcherServlet.doService(DispatcherServlet.java:963) ~[spring-webmvc-5.3.10.jar:5.3.10]
	at org.springframework.web.servlet.FrameworkServlet.processRequest(FrameworkServlet.java:1006) ~[spring-webmvc-5.3.10.jar:5.3.10]
	at org.springframework.web.servlet.FrameworkServlet.doGet(FrameworkServlet.java:898) ~[spring-webmvc-5.3.10.jar:5.3.10]
	at javax.servlet.http.HttpServlet.service(HttpServlet.java:655) ~[tomcat-embed-core-9.0.53.jar:4.0.FR]
	at org.springframework.web.servlet.FrameworkServlet.service(FrameworkServlet.java:883) ~[spring-webmvc-5.3.10.jar:5.3.10]
	at javax.servlet.http.HttpServlet.service(HttpServlet.java:764) ~[tomcat-embed-core-9.0.53.jar:4.0.FR]
	at org.apache.catalina.core.ApplicationFilterChain.internalDoFilter(ApplicationFilterChain.java:227) ~[tomcat-embed-core-9.0.53.jar:9.0.53]

Can’t find getErrorPath() method in ErrorController

insert image description here

Since the author is using the latest spring-boot 2.5.5 version, the getErrorPath() API was removed from ErrorController, but spring-cloud-starter-netflix-zuul 2.2.7.RELEASE still calls this API and causes this error.

Solution

Method 1: Use a lower version of spring boot to be compatible with spring-cloud-starter-netflix-zuul

Use spring boot 2.4.8 to be compatible with spring-cloud-starter-netflix-zuul

Added:
spring-cloud and netflix-zuul will work fine in the following versions:

spring-boot-starter-parent: 2.1.3.RELEASE java.version
: 1.8
spring-cloud.version: Greenwich.RELEASE
spring-cloud-starter-netflix-zuul: 2.1.0.RELEASE
spring-cloud-starter-netflix- eureka-client: 2.1.0.RELEASE
jackson-dataformat-xml: 2.9.9
spring-cloud-starter-netflix-eureka-server: 2.1.0.RELEASE

Method 2: Create a BeanPostProcessor to intercept the call of the lookupHandler method

import java.lang.reflect.Constructor;
import java.lang.reflect.Method;
import org.springframework.beans.BeansException;
import org.springframework.beans.factory.annotation.Autowired;
import org.springframework.beans.factory.config.BeanPostProcessor;
import org.springframework.boot.web.servlet.error.ErrorController;
import org.springframework.cglib.proxy.Callback;
import org.springframework.cglib.proxy.CallbackFilter;
import org.springframework.cglib.proxy.Enhancer;
import org.springframework.cglib.proxy.MethodInterceptor;
import org.springframework.cglib.proxy.MethodProxy;
import org.springframework.cglib.proxy.NoOp;
import org.springframework.cloud.netflix.zuul.filters.RouteLocator;
import org.springframework.cloud.netflix.zuul.web.ZuulController;
import org.springframework.cloud.netflix.zuul.web.ZuulHandlerMapping;
import org.springframework.context.annotation.Bean;
import org.springframework.context.annotation.Configuration;

/**
 * Fix for Zuul configuration with Spring Boot 2.5.x + Zuul - "NoSuchMethodError: ErrorController.getErrorPath()":
 */
@Configuration
public class ZuulConfiguration {
  /**
   * The path returned by ErrorController.getErrorPath() with Spring Boot < 2.5
   * (and no longer available on Spring Boot >= 2.5).
   */
  private static final String ERROR_PATH = "/error";
  private static final String METHOD = "lookupHandler";

  /**
   * Constructs a new bean post-processor for Zuul.
   *
   * @param routeLocator    the route locator.
   * @param zuulController  the Zuul controller.
   * @param errorController the error controller.
   * @return the new bean post-processor.
   */
  @Bean
  public ZuulPostProcessor zuulPostProcessor(@Autowired RouteLocator routeLocator,
                                             @Autowired ZuulController zuulController,
                                             @Autowired(required = false) ErrorController errorController) {
    return new ZuulPostProcessor(routeLocator, zuulController, errorController);
  }

  private enum LookupHandlerCallbackFilter implements CallbackFilter {
    INSTANCE;

    @Override
    public int accept(Method method) {
      if (METHOD.equals(method.getName())) {
        return 0;
      }
      return 1;
    }
  }

  private enum LookupHandlerMethodInterceptor implements MethodInterceptor {
    INSTANCE;

    @Override
    public Object intercept(Object target, Method method, Object[] args, MethodProxy methodProxy) throws Throwable {
      if (ERROR_PATH.equals(args[0])) {
        // by entering this branch we avoid the ZuulHandlerMapping.lookupHandler method to trigger the 
        // NoSuchMethodError 
        return null;
      }
      return methodProxy.invokeSuper(target, args);
    }
  }

  private static final class ZuulPostProcessor implements BeanPostProcessor {

    private final RouteLocator routeLocator;
    private final ZuulController zuulController;
    private final boolean hasErrorController;

    ZuulPostProcessor(RouteLocator routeLocator, ZuulController zuulController, ErrorController errorController) {
      this.routeLocator = routeLocator;
      this.zuulController = zuulController;
      this.hasErrorController = (errorController != null);
    }

    @Override
    public Object postProcessAfterInitialization(Object bean, String beanName) throws BeansException {
      if (hasErrorController && (bean instanceof ZuulHandlerMapping)) {
        Enhancer enhancer = new Enhancer();
        enhancer.setSuperclass(ZuulHandlerMapping.class);
        enhancer.setCallbackFilter(LookupHandlerCallbackFilter.INSTANCE); // only for lookupHandler
        enhancer.setCallbacks(new Callback[] {LookupHandlerMethodInterceptor.INSTANCE, NoOp.INSTANCE});
        Constructor<?> ctor = ZuulHandlerMapping.class.getConstructors()[0];
        return enhancer.create(ctor.getParameterTypes(), new Object[] {routeLocator, zuulController});
      }
      return bean;
    }
  }
}

Test code:

@RestController
@RequestMapping("/set")
public class TestController {

    @RequestMapping("/test")
    public String test(){
        return "hello world!";
    }
}

The operation is successful, no error is reported:
insert image description here

Original address: https://stackoverflow.com/questions/68100671/nosuchmethoderror-org-springframework-boot-web-servlet-error-errorcontroller-ge

[Solved] flink web ui Submit Task Error: Server Respoonse Message-Internal server error

Environmental description

During this period of time, I was sorting out flink. I just tested an application before today: submitting a task on the web ui reported an error:

As shown in the figure: The running main program class name and degree of parallelism are specified here, and then an error occurs when clicking submit

It is impossible to accurately locate the cause of the error simply from the error information on the page. At this time, you can view the cause of the error through the log file’

[hui@hadoop103 ~]$ cd /opt/module/flink-local/log/ 
[hui@hadoop103 log]$ ls - ltr
Total dosage 440
-rw-r--r-- 1 hui wd 43688 Jun 10 06:15 flink-hui-taskexecutor-0-hadoop103.log.1
-rw-r--r-- 1 hui wd 37268 Jun 10 06:15 flink-hui-standalonesession-0-hadoop103.log.1
-rw-r--r-- 1 hui wd 750 Jun 10 06:16 flink-hui-standalonesession-0- hadoop103.out
 -rw-r--r-- 1 hui wd 750 Jun 10 06:16 flink -hui-taskexecutor-0- hadoop103.out
 -rw-r--r-- 1 hui wd 36562 Jun 10 06:16 flink-hui-taskexecutor-0- hadoop103.log
 -rw-r--r-- 1 hui wd 28430 Jun 10 06:22 flink-hui-standalonesession-1-hadoop103.log.1
-rw-r--r-- 1 hui wd 32769 Jun 10 06:22 flink-hui-standalonesession-1-hadoop103.log.2
-rw-r--r-- 1 hui wd 36750 Jun 10 06:26 flink-hui-standalonesession-0- hadoop103.log
 -rw-r--r-- 1 hui wd 31715 Jun 10 08:28 flink -hui-client- hadoop103.log
 -rw-r--r-- 1 hui wd 128992 Jun 10 09:42 flink-hui-standalonesession-1-hadoop103.log.3
-rw-r--r-- 1 hui wd 750 Jun 10 16:39 flink-hui-standalonesession-1- hadoop103.out
 -rw-r--r-- 1 hui wd 47418 Jun 10 16:50 flink -hui-standalonesession-1- hadoop103.log
[hui@hadoop103 log]$ tail -100 flink-hui-standalonesession-1- hadoop103.log
        at java.util.concurrent.ThreadPoolExecutor$Worker.run(ThreadPoolExecutor.java:624 ) [?: 1.8.0_144]
        at java.lang.Thread.run(Thread.java:748 ) [?: 1.8.0_144]
Caused by: java.lang.RuntimeException: No data for required key 'port' 
        at org.apache.flink.api.java.utils.AbstractParameterTool.getRequired(AbstractParameterTool.java: 79) ~[flink-dist_2.12-1.13. 0.jar:1.13.0 ]
        at org.apache.flink.api.java.utils.AbstractParameterTool.getInt(AbstractParameterTool.java: 106) ~[flink-dist_2.12-1.13.0.jar:1.13.0 ]
        at org.wdh01.wc.StreamWordCount.main(StreamWordCount.java: 20) ~[?:? ]
        at sun.reflect.NativeMethodAccessorImpl.invoke0(Native Method) ~[?: 1.8.0_144]
        at sun.reflect.NativeMethodAccessorImpl.invoke(NativeMethodAccessorImpl.java:62 ) ~[?: 1.8.0_144]
        at sun.reflect.DelegatingMethodAccessorImpl.invoke(DelegatingMethodAccessorImpl.java:43 ) ~[?: 1.8.0_144]
        at java.lang.reflect.Method.invoke(Method.java:498 ) ~[?: 1.8.0_144]
        at org.apache.flink.client.program.PackagedProgram.callMainMethod(PackagedProgram.java: 355) ~[flink-dist_2.12-1.13.0.jar:1.13.0 ]
        ... 13 more
 2022-06-10 16:49:21,738 ERROR org.apache.flink.runtime.webmonitor.handlers.JarRunHandler[] - Exception occurred in REST handler: Could not execute application.
 2022-06-10 16: 49:30,964 WARN org.apache.flink.runtime.webmonitor.handlers.JarRunHandler[] - Configuring the job submission via query parameters is deprecated. Please migrate to submitting a JSON request instead.
 2022-06-10 16:49:31,006 INFO org.apache.flink.client.ClientUtils[] - Starting program (detached: true )
 2022-06-10 16:49:31,007 WARN org.apache.flink.client.deployment.application.DetachedApplicationRunner[] - Could not execute application :
org.apache.flink.client.program.ProgramInvocationException: The main method caused an error: No data for required key 'port' 
        at org.apache.flink.client.program.PackagedProgram.callMainMethod(PackagedProgram.java: 372) ~[ flink-dist_2.12-1.13.0.jar:1.13.0 ]
        at org.apache.flink.client.program.PackagedProgram.invokeInteractiveModeForExecution(PackagedProgram.java: 222) ~[flink-dist_2.12-1.13.0.jar:1.13.0 ]
        at org.apache.flink.client.ClientUtils.executeProgram(ClientUtils.java: 114) ~[flink-dist_2.12-1.13.0.jar:1.13.0 ]
        at org.apache.flink.client.deployment.application.DetachedApplicationRunner.tryExecuteJobs(DetachedApplicationRunner.java: 84) ~[flink-dist_2.12-1.13.0.jar:1.13.0 ]
        at org.apache.flink.client.deployment.application.DetachedApplicationRunner.run(DetachedApplicationRunner.java: 70) ~[flink-dist_2.12-1.13.0.jar:1.13.0 ]
        at org.apache.flink.runtime.webmonitor.handlers.JarRunHandler.lambda$handleRequest$ 0(JarRunHandler.java:102) ~[flink-dist_2.12-1.13.0.jar:1.13.0 ]
        at java.util.concurrent.CompletableFuture$AsyncSupply.run(CompletableFuture.java: 1590) [?: 1.8.0_144]
        at java.util.concurrent.Executors$RunnableAdapter.call(Executors.java:511 ) [?: 1.8.0_144]
        at java.util.concurrent.FutureTask.run(FutureTask.java:266 ) [?: 1.8.0_144]
        at java.util.concurrent.ScheduledThreadPoolExecutor$ScheduledFutureTask.access$ 201(ScheduledThreadPoolExecutor.java:180) [?: 1.8.0_144]
        at java.util.concurrent.ScheduledThreadPoolExecutor$ScheduledFutureTask.run(ScheduledThreadPoolExecutor.java: 293) [?: 1.8.0_144]
        at java.util.concurrent.ThreadPoolExecutor.runWorker(ThreadPoolExecutor.java:1149 ) [?: 1.8.0_144]
        at java.util.concurrent.ThreadPoolExecutor$Worker.run(ThreadPoolExecutor.java:624 ) [?: 1.8.0_144]
        at java.lang.Thread.run(Thread.java:748 ) [?: 1.8.0_144]
Caused by: java.lang.RuntimeException: No data for required key 'port' 
        at org.apache.flink.api.java.utils.AbstractParameterTool.getRequired(AbstractParameterTool.java: 79) ~[flink-dist_2.12-1.13. 0.jar:1.13.0 ]
        at org.apache.flink.api.java.utils.AbstractParameterTool.getInt(AbstractParameterTool.java: 106) ~[flink-dist_2.12-1.13.0.jar:1.13.0 ]
        at org.wdh01.wc.StreamWordCount.main(StreamWordCount.java: 20) ~[?:? ]
        at sun.reflect.NativeMethodAccessorImpl.invoke0(Native Method) ~[?: 1.8.0_144]
        at sun.reflect.NativeMethodAccessorImpl.invoke(NativeMethodAccessorImpl.java:62 ) ~[?: 1.8.0_144]
        at sun.reflect.DelegatingMethodAccessorImpl.invoke(DelegatingMethodAccessorImpl.java:43 ) ~[?: 1.8.0_144]
        at java.lang.reflect.Method.invoke(Method.java:498 ) ~[?: 1.8.0_144]
        at org.apache.flink.client.program.PackagedProgram.callMainMethod(PackagedProgram.java: 355) ~[flink-dist_2.12-1.13.0.jar:1.13.0 ]
        ... 13 more
 2022-06-10 16:49:31,024 ERROR org.apache.flink.runtime.webmonitor.handlers.JarRunHandler[] - Exception occurred in REST handler: Could not execute application.
 2022-06-10 16: 49:39,493 WARN org.apache.flink.runtime.webmonitor.handlers.JarRunHandler[] - Configuring the job submission via query parameters is deprecated. Please migrate to submitting a JSON request instead.
 2022-06-10 16:49:39,501 INFO org.apache.flink.client.ClientUtils[] - Starting program (detached: true )
 2022-06-10 16:49:39,501 WARN org.apache.flink.client.deployment.application.DetachedApplicationRunner[] - Could not execute application :
org.apache.flink.client.program.ProgramInvocationException: The main method caused an error: No data for required key 'port' 
        at org.apache.flink.client.program.PackagedProgram.callMainMethod(PackagedProgram.java: 372) ~[ flink-dist_2.12-1.13.0.jar:1.13.0 ]
        at org.apache.flink.client.program.PackagedProgram.invokeInteractiveModeForExecution(PackagedProgram.java: 222) ~[flink-dist_2.12-1.13.0.jar:1.13.0 ]
        at org.apache.flink.client.ClientUtils.executeProgram(ClientUtils.java: 114) ~[flink-dist_2.12-1.13.0.jar:1.13.0 ]
        at org.apache.flink.client.deployment.application.DetachedApplicationRunner.tryExecuteJobs(DetachedApplicationRunner.java: 84) ~[flink-dist_2.12-1.13.0.jar:1.13.0 ]
        at org.apache.flink.client.deployment.application.DetachedApplicationRunner.run(DetachedApplicationRunner.java: 70) ~[flink-dist_2.12-1.13.0.jar:1.13.0 ]
        at org.apache.flink.runtime.webmonitor.handlers.JarRunHandler.lambda$handleRequest$ 0(JarRunHandler.java:102) ~[flink-dist_2.12-1.13.0.jar:1.13.0 ]
        at java.util.concurrent.CompletableFuture$AsyncSupply.run(CompletableFuture.java: 1590) [?: 1.8.0_144]
        at java.util.concurrent.Executors$RunnableAdapter.call(Executors.java:511 ) [?: 1.8.0_144]
        at java.util.concurrent.FutureTask.run(FutureTask.java:266 ) [?: 1.8.0_144]
        at java.util.concurrent.ScheduledThreadPoolExecutor$ScheduledFutureTask.access$ 201(ScheduledThreadPoolExecutor.java:180) [?: 1.8.0_144]
        at java.util.concurrent.ScheduledThreadPoolExecutor$ScheduledFutureTask.run(ScheduledThreadPoolExecutor.java: 293) [?: 1.8.0_144]
        at java.util.concurrent.ThreadPoolExecutor.runWorker(ThreadPoolExecutor.java:1149 ) [?: 1.8.0_144]
        at java.util.concurrent.ThreadPoolExecutor$Worker.run(ThreadPoolExecutor.java:624 ) [?: 1.8.0_144]
        at java.lang.Thread.run(Thread.java:748 ) [?: 1.8.0_144]
Caused by: java.lang.RuntimeException: No data for required key 'port' 
        at org.apache.flink.api.java.utils.AbstractParameterTool.getRequired(AbstractParameterTool.java: 79) ~[flink-dist_2.12-1.13. 0.jar:1.13.0 ]
        at org.apache.flink.api.java.utils.AbstractParameterTool.getInt(AbstractParameterTool.java: 106) ~[flink-dist_2.12-1.13.0.jar:1.13.0 ]
        at org.wdh01.wc.StreamWordCount.main(StreamWordCount.java: 20) ~[?:? ]
        at sun.reflect.NativeMethodAccessorImpl.invoke0(Native Method) ~[?: 1.8.0_144]
        at sun.reflect.NativeMethodAccessorImpl.invoke(NativeMethodAccessorImpl.java:62 ) ~[?: 1.8.0_144]
        at sun.reflect.DelegatingMethodAccessorImpl.invoke(DelegatingMethodAccessorImpl.java:43 ) ~[?: 1.8.0_144]
        at java.lang.reflect.Method.invoke(Method.java:498 ) ~[?: 1.8.0_144]
        at org.apache.flink.client.program.PackagedProgram.callMainMethod(PackagedProgram.java: 355) ~[flink-dist_2.12-1.13.0.jar:1.13.0 ]
        ... 13 more
 2022-06-10 16:49:39,507 ERROR org.apache.flink.runtime.webmonitor.handlers.JarRunHandler[] - Exception occurred in REST handler: Could not execute application.
 2022-06-10 16: 50:18,223 WARN org.apache.flink.runtime.webmonitor.handlers.JarRunHandler[] - Configuring the job submission via query parameters is deprecated. Please migrate to submitting a JSON request instead.
 2022-06-10 16:50:18,232 INFO org.apache.flink.client.ClientUtils[] - Starting program (detached: true )
 2022-06-10 16:50:18,232 WARN org.apache.flink.client.deployment.application.DetachedApplicationRunner[] - Could not execute application :
org.apache.flink.client.program.ProgramInvocationException: The main method caused an error: No data for required key 'port' 
        at org.apache.flink.client.program.PackagedProgram.callMainMethod(PackagedProgram.java: 372) ~[ flink-dist_2.12-1.13.0.jar:1.13.0 ]
        at org.apache.flink.client.program.PackagedProgram.invokeInteractiveModeForExecution(PackagedProgram.java: 222) ~[flink-dist_2.12-1.13.0.jar:1.13.0 ]
        at org.apache.flink.client.ClientUtils.executeProgram(ClientUtils.java: 114) ~[flink-dist_2.12-1.13.0.jar:1.13.0 ]
        at org.apache.flink.client.deployment.application.DetachedApplicationRunner.tryExecuteJobs(DetachedApplicationRunner.java: 84) ~[flink-dist_2.12-1.13.0.jar:1.13.0 ]
        at org.apache.flink.client.deployment.application.DetachedApplicationRunner.run(DetachedApplicationRunner.java: 70) ~[flink-dist_2.12-1.13.0.jar:1.13.0 ]
        at org.apache.flink.runtime.webmonitor.handlers.JarRunHandler.lambda$handleRequest$ 0(JarRunHandler.java:102) ~[flink-dist_2.12-1.13.0.jar:1.13.0 ]
        at java.util.concurrent.CompletableFuture$AsyncSupply.run(CompletableFuture.java: 1590) [?: 1.8.0_144]
        at java.util.concurrent.Executors$RunnableAdapter.call(Executors.java:511 ) [?: 1.8.0_144]
        at java.util.concurrent.FutureTask.run(FutureTask.java:266 ) [?: 1.8.0_144]
        at java.util.concurrent.ScheduledThreadPoolExecutor$ScheduledFutureTask.access$ 201(ScheduledThreadPoolExecutor.java:180) [?: 1.8.0_144]
        at java.util.concurrent.ScheduledThreadPoolExecutor$ScheduledFutureTask.run(ScheduledThreadPoolExecutor.java: 293) [?: 1.8.0_144]
        at java.util.concurrent.ThreadPoolExecutor.runWorker(ThreadPoolExecutor.java:1149 ) [?: 1.8.0_144]
        at java.util.concurrent.ThreadPoolExecutor$Worker.run(ThreadPoolExecutor.java:624 ) [?: 1.8.0_144]
        at java.lang.Thread.run(Thread.java:748 ) [?: 1.8.0_144]
Caused by: java.lang.RuntimeException: No data for required key 'port' 
        at org.apache.flink.api.java.utils.AbstractParameterTool.getRequired(AbstractParameterTool.java: 79) ~[flink-dist_2.12-1.13. 0.jar:1.13.0 ]
        at org.apache.flink.api.java.utils.AbstractParameterTool.getInt(AbstractParameterTool.java: 106) ~[flink-dist_2.12-1.13.0.jar:1.13.0 ]
        at org.wdh01.wc.StreamWordCount.main(StreamWordCount.java: 20) ~[?:? ]
        at sun.reflect.NativeMethodAccessorImpl.invoke0(Native Method) ~[?: 1.8.0_144]
        at sun.reflect.NativeMethodAccessorImpl.invoke(NativeMethodAccessorImpl.java:62 ) ~[?: 1.8.0_144]
        at sun.reflect.DelegatingMethodAccessorImpl.invoke(DelegatingMethodAccessorImpl.java:43 ) ~[?: 1.8.0_144]
        at java.lang.reflect.Method.invoke(Method.java:498 ) ~[?: 1.8.0_144]
        at org.apache.flink.client.program.PackagedProgram.callMainMethod(PackagedProgram.java: 355) ~[flink-dist_2.12-1.13.0.jar:1.13.0 ]
        ... 13 more
 2022-06-10 16:50:18,247 ERROR org.apache.flink.runtime.webmonitor.handlers.JarRunHandler[] - Exception occurred in REST handler: Could not execute application.

Looking through the log, it turns out that the running java program requires two parameters, that is to say, the program needs to dynamically pass in parameters at runtime: its java program is like this

    public  static  void main(String[] args) throws Exception {

        // Read host & port from parameters 
        ParameterTool parameterTool = ParameterTool.fromArgs(args);
        String host = parameterTool.get("host" );
         int port = parameterTool.getInt("port" );

        StreamExecutionEnvironment env = StreamExecutionEnvironment.getExecutionEnvironment();
        DataStreamSource <String> socketTextStream = env.socketTextStream(host, port);
        socketTextStream.flatMap((String line, Collector <Tuple2<String, Long>> out) -> {
            String[] s = line.split(" " );
             for (String s1 : s) {
                out.collect(Tuple2.of(s1, 1L ));
            }
        }).returns(Types.TUPLE(Types.STRING, Types.LONG))
                .keyBy(data -> data.f0)
                .sum( 1 )
                .print();

        env.execute();
    }

So when submitting a job, you need to pass in two parameters’

This will submit the task. If there is no problem when running the program, don’t worry, in general, you can judge the problem through the log, so you can deal with it urgently.

Mysql Error: 1140 – In aggregated query without GROUP BY, expression #2 of SELECT list contains nonaggregated column ‘a.store’; this is incompatible with sql_mode=only_full_group_by


According to the information,
group by has been optimized after MySQL 5.7. The version after the default startup improvement enables ONLY_FULL_GROUP_BY mode.

That is, ONLY_FULL_GROUP_BY is a sql_mode provided by the MySQL database, and this sql_mode is used to ensure the validity of the SQL statement “grouping for the most value”. This mode adopts the processing method with databases such as Oracle and DB2. That is, columns with ambiguous semantics are not allowed in the select target list.

Solution:
As long as there are aggregation functions sum(), count(), max(), avg() and other functions, group by needs to be used

[Solved] Mybatis multi-table query error: Column ‘id’ in field list is ambiguous

Mybatis error example:


<resultMap id="JoinResultMap" type="com.WorkDto">
	<id column="id" jdbcType="BIGINT" property="id"/>
	<result column="work_city_code" jdbcType="VARCHAR" property="workCityCode"/>

	
	<collection property="guardInfos" ofType="com.GuardInfo">
		<id column="id"  jdbcType="BIGINT" property="id"  />
		<result column="work_id" jdbcType="BIGINT" property="workId" />
		<result column="guarder_code" jdbcType="VARCHAR" property="guarderCode" />
	</collection>
</resultMap>


<select id="selectById" parameterType="java.lang.Long" resultMap="JoinResultMap">
	select t1.id, work_city_code, 
	t2.id , t2.work_id, t2.guarder_code 
	from tt_work t1
	left join tt_work_info t2 
	on t1.id=t2.work_id
	where id = #{id,jdbcType=BIGINT}
</select>

The above will report an error: Column ‘id’ in field list is ambiguous

wrong reason:

When Mybatis multi-table query, multiple tables have fields with the same name, such as id, the names are repeated, and the corresponding table name is not specified.
There are two places to pay attention to:
(1) Change the column of Mybatis in one of the repeated fields to another name.
(2) Field plus the corresponding table name.

amend as below:

The following will
(1) modify the column corresponding to one of the ids to other unique names guard_info_id
(2) add the table name t1.id to the id in the query results and query conditions

<resultMap id="JoinResultMap" type="com.WorkDto">
	<id column="id" jdbcType="BIGINT" property="id"/>
	<result column="work_city_code" jdbcType="VARCHAR" property="workCityCode"/>

	<collection property="guardInfos" ofType="com.GuardInfo">
		<id column="guarder_info_id"  jdbcType="BIGINT" property="id"  />
		<result column="work_id" jdbcType="BIGINT" property="workId" />
		<result column="guarder_code" jdbcType="VARCHAR" property="guarderCode" />
	</collection>
</resultMap>


<select id="selectById" parameterType="java.lang.Long" resultMap="JoinResultMap">
	select t1.id,  work_city_code, 
	t2.id as guarder_info_id, t2.work_id, t2.guarder_code 
	from tt_work t1
	left join tt_work_info t2 
	on t1.id=t2.work_id
	where t1.id = #{id,jdbcType=BIGINT}
</select>

[Solved] fluentd Log Error: read timeout reached

Background: The architecture is that fluentd logs are collected locally and then uploaded to es. It is found that the local stock of logs collected by fluentd has been increasing, and the logs are not written to es. The fluentd log reports an error of read timeout reached, as shown in the following figure


Check:

1. Suspect the disk performance problem, use the dd command to test the disk used by es-data, and find that the writing speed is still OK, so this problem is ruled out

dd bs=128k count=10k if=/dev/zero of=test conv=fdatasync


2. It is suspected that there is an error in the buffer file. According to the reported chunkid, go to the /var/log/td-agent/buffer/elasticsearch directory of the corresponding fluentd host to remove the errored file to another place, then restart fluentd and find that there are new The chunkid file appears to block log writing, after several attempts, this problem is ruled out.

3. It is suspected to be caused by the number of threads of fluentd, and the parameter is

flush_thread_count # If not set, the default is 1

Set this parameter to 8, restart fluentd again, and find that the error of read timeout reached will still be reported, and when the number of threads is 1, it will report 8 at a time. The cause of the problem is not this parameter.

4. It is suspected that the timeout time of fluentd is too short, and the parameter is

request_timeout 240s #Originally 120s

Try to set it to 240s. After a long time, the error of read timeout reached will still be reported. If it is set to 2400s, because the time is too long, no error will be reported for the time being, but the number of local logs is still increasing and has not decreased. It is suspected that it has nothing to do with this parameter. Try other Method

5. When querying data, it is found that there are similar problems by adding the following parameters to solve the problem. The first two have been set, and the last one has not been set.

reconnect_on_error true

reload_on_failure true

reload_connections false

reload_connections false # default is true

It is possible to adjust how the elasticsearch-transport host reload feature works. By default, it will reload the host list from the server every 10,000 requests to spread the load. This can be a problem if your Elasticsearch cluster is behind a reverse proxy, as the Fluentd process may not have direct access to the Elasticsearch nodes.

The es svc used in fluentd in the cluster is equivalent to reverse proxying the Elasticsearch node. After adding this configuration to fluentd and restarting, it is found that the log is written normally, and the problem is solved. The reason why the old platform is OK is because the old platform is iptables, and the iptables rules are generated to convert nat to ip address. The new platform is all ipvs, and ipvs is directly routed to the corresponding pod-ip, which is equivalent to a reverse proxy, so this parameter must be added.