Category Archives: Error

[Solved] Error reading packet from server: Lost connection to MySQL server during query ( server_errno=20131)

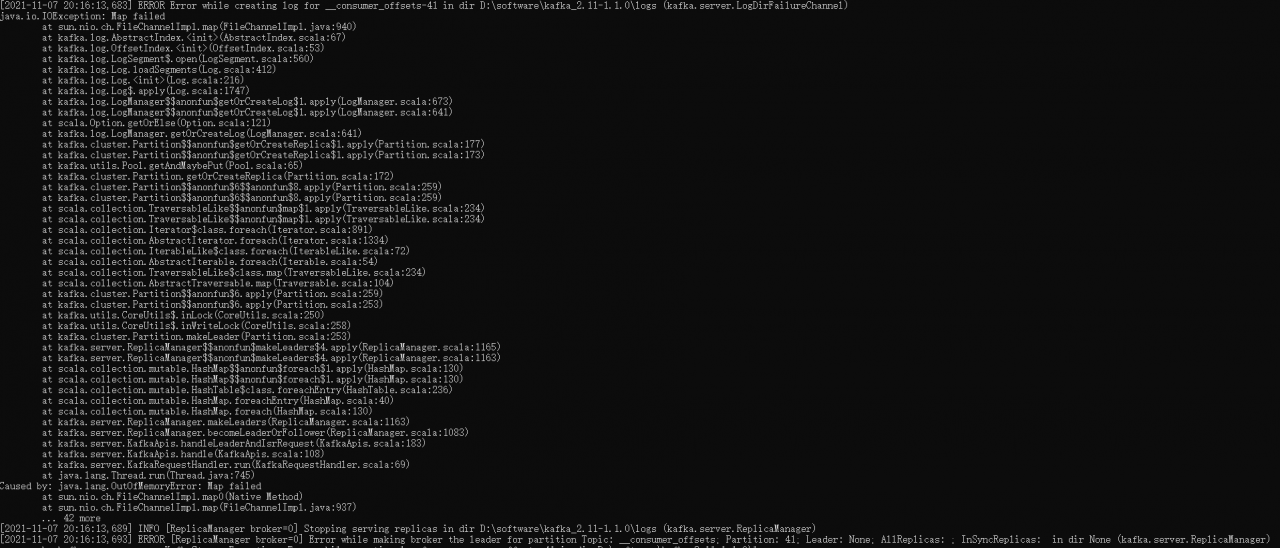
Problem Description:

After receiving four or five SMS messages of master-slave disconnection and recovery in one night, check the error information in the error log of MySQL (5.6) slave database in the production environment (master-slave architecture). Generally speaking, the slave database lost its connection with the master database, resulting in io thread reconnection.

2019-12-02 03:46:44 47114 [ERROR] Error reading packet from server: Lost connection to MySQL server during query ( server_errno=2013)
2019-12-02 03:46:44 47114 [Note] Slave I/O thread: Failed reading log event, reconnecting to retry, log 'binlog.002295' at position 386140629
2019-12-02 03:46:44 47114 [Warning] Storing MySQL user name or password information in the master info repository is not secure and is therefore not recommended. Please consider using the USER and PASSWORD connection options for START SLAVE; see the 'START SLAVE Syntax' in the MySQL Manual for more information.
2019-12-02 03:46:54 47114 [ERROR] Slave I/O: error reconnecting to master 'repli@192.168.11.10:3306' - retry-time: 60  retries: 1, Error_code: 2013
2019-12-02 03:48:04 47114 [ERROR] Slave I/O: error reconnecting to master 'repli@192.168.11.10:3306' - retry-time: 60  retries: 2, Error_code: 2013
2019-12-02 03:49:14 47114 [ERROR] Slave I/O: error reconnecting to master 'repli@192.168.11.10:3306' - retry-time: 60  retries: 3, Error_code: 2013
2019-12-02 03:50:24 47114 [ERROR] Slave I/O: error reconnecting to master 'repli@192.168.11.10:3306' - retry-time: 60  retries: 4, Error_code: 2013
2019-12-02 03:51:34 47114 [ERROR] Slave I/O: error reconnecting to master 'repli@192.168.11.10:3306' - retry-time: 60  retries: 5, Error_code: 2013
2019-12-02 03:52:44 47114 [ERROR] Slave I/O: error reconnecting to master 'repli@192.168.11.10:3306' - retry-time: 60  retries: 6, Error_code: 2013
2019-12-02 03:53:54 47114 [ERROR] Slave I/O: error reconnecting to master 'repli@192.168.11.10:3306' - retry-time: 60  retries: 7, Error_code: 2013
2019-12-02 03:55:04 47114 [ERROR] Slave I/O: error reconnecting to master 'repli@192.168.11.10:3306' - retry-time: 60  retries: 8, Error_code: 2013
2019-12-02 03:56:06 47114 [Note] Slave: connected to master 'repli@192.168.11.10:3306',replication resumed in log 'binlog.002295' at position 386140629
2019-12-02 04:01:00 47114 [ERROR] Error reading packet from server: Lost connection to MySQL server during query ( server_errno=2013)
2019-12-02 04:01:00 47114 [Note] Slave I/O thread: Failed reading log event, reconnecting to retry, log 'binlog.002295' at position 45291556

Query official documents:

B.4.2.3 Lost connection to MySQL server

There are three likely causes for this error message.

Usually it indicates network connectivity trouble and you should check the condition of your network if this error occurs frequently. If the error message includes during query,” this is probably the case you are experiencing. 

Sometimes the during query form happens when millions of rows are being sent as part of one or more queries. If you know that this is happening, you should try increasing net_read_timeout from its default of 30 seconds to 60 seconds or longer, sufficient for the data transfer to complete.

More rarely, it can happen when the client is attempting the initial connection to the server. In this case, if your connect_timeout value is set to only a few seconds, you may be able to resolve the problem by increasing it to ten seconds, perhaps more if you have a very long distance or slow connection. You can determine whether you are experiencing this more uncommon cause by using SHOW GLOBAL STATUS LIKE 'Aborted_connects'. It will increase by one for each initial connection attempt that the server aborts. You may see reading authorization packet as part of the error message; if so, that also suggests that this is the solution that you need.

If the cause is none of those just described, you may be experiencing a problem with BLOB values that are larger than max_allowed_packet, which can cause this error with some clients. Sometime you may see an ER_NET_PACKET_TOO_LARGE error, and that confirms that you need to increase max_allowed_packet. 

Check step by step according to official documents:

First of all, we can eliminate the network reasons, because it is a LAN, there is no problem in the network environment, and there is no firewall interception, etc;

Because the error message from the slave library contains during query, there is no other error message, such as reading authorization packet, The reason for this er_NET_PACKET_TOO_error should be as follows:

Sometimes the during query form happens when millions of rows are being sent as part of one or more queries. If you know that this is happening, you should try increasing net_read_timeout from its default of 30 seconds to 60 seconds or longer, sufficient for the data transfer to complete.
According to the official recommendation, the value of the parameter net_read_timeout can be increased

Combined with the scenario of master-slave replication, query binary logs and business personnel. The master database will generate many large transactions during this time period. Since the default time for reading data from the main library is 30 seconds (the default value of the net_read_timeout parameter), the slave library connection process will be closed after 30 seconds. Specifically, when reading a transaction from the IO thread of the library, the transaction may not be read in 30 seconds because the transaction is too large. However, the transaction from the database to the database is incomplete. It is considered that there is a problem with the connection to the primary database, so the primary database will be reconnected.

But after adjusting the net_read_ timeout = 900, the error will still appear!!

Therefore, it is assumed that when the master database sends data to the slave database, a large transaction cannot be sent within a limited time (net_write_timeout, default 30s), so the transaction cannot be read no matter how long it takes to read from the database.

Therefore, adjust the net of the main library_write_timeout=300

This error is not reported later.

There are two ways to change the value:

1Use set GLOBAL command. For example: set GLOBAL net_write_timeout=120;
2Modify the parameter value in the configuration file of Mysql: net_write_timeout=120
After that, restart the database service.

[Solved] Error: `resize` should not be called during main process.

Use echarts to redraw the picture according to the screen changes. I have been reporting this error for a long time, but I haven’t found the problem

watch: {
    option: {
      handler() {
        this.myEchart = echarts.init(this.$refs.echartsRef)
        this.myEchart.setOption(this.option)
        // this.mountedEchart()
      },
      immediate: false
    }
  },
  mounted() {
    // this.mountedEchart()
    // this.myEchart = echarts.init(this.$refs.echartsRef)
    // this.myEchart.setOption(this.option)

    //Redrawing when the screen size changes
    window.addEventListener('resize', () => {
      this.myEchart.resize()
    })
  },

Because this component is encapsulated by me and needs to listen to the change of option to redraw the diagram, the init diagram is displayed in the watch

Later, I initialized seals. Init() in both watch and mounted, and this error was solved.

watch: {
    option: {
      handler() {
        // this.myEchart = echarts.init(this.$refs.echartsRef)
        // this.myEchart.setOption(this.option)
        this.mountedEchart()
      },
      immediate: false
    }
  },
  mounted() {
    this.mountedEchart()
    // this.myEchart = echarts.init(this.$refs.echartsRef)
    // this.myEchart.setOption(this.option)

    //Redrawing when the screen size changes
    window.addEventListener('resize', () => {
      this.myEchart.resize()
    })
  },
  methods: {
    mountedEchart() {
      this.myEchart = echarts.init(this.$refs.echartsRef)
      this.myEchart.setOption(this.option)
    }
  },

However, another warning appears charts.js?1be7:2178 There is a chart instance already initialized on the dom.

After unremitting efforts, I finally found the problem. I still didn’t understand the grammar well and didn’t pay attention to the warning itself. In fact, the problem is the same as the warning. The ecarts instance already exists

I registered again when the instance existed

ecarts.init (this.$refs.Ecartsref) runs twice, and all warnings appear

In fact, just redraw the icon and reset setoption. There is no need to register again

watch: {
    option: {
      handler() {
        this.mountedEchart()
      }
    }
  },
  mounted() {
    this.myEchart = echarts.init(this.$refs.echartsRef)
    this.mountedEchart()
    // this.myEchart.setOption(this.option)

    //Redrawing when the screen size changes
    window.addEventListener('resize', () => {
      this.myEchart.resize()
    })
  },
  methods: {
    mountedEchart() {
      // this.myEchart = echarts.init(this.$refs.echartsRef)
      //Redraw as long as setOption on it, no need to init again, again init will appear but another warning
      //`echarts.js?1be7:2178 There is a chart instance already initialized on the dom.`
      this.myEchart.setOption(this.option)
    }
  },

tensorboard [Fatal error in launcher: Unable to create process using]

use tensorboard --logdir

An error is reported

Fatal error in launcher: Unable to create process using

Change to

python -m tensorboard.main --logdir

Measured operable

ps.

This problem occurs in the anaconda environment of several different versions of Python. It is speculated that the Python interpreter of base is used by default. At present, the problem has not been solved perfectly

How to Solve Error: Failure [INSTALL_FAILED_INSUFFICIENT_STORAGE]

Installing build/app/outputs/flutter-apk/app.apk… 3.7s
Error: ADB exited with exit code 1
Performing Streamed Install
adb: failed to install /Users/mm/Desktop/projects/ershou/build/app/outputs/flutter-apk/app.apk: Failure [INSTALL_FAILED_INSUFFICIENT_STORAGE]
Error launching application on EML AL00.

The reason is that the phone has no memory to install apk

Maniaro distribution installation snap application error: classic confinement requires snaps under /snap or symlink from /snap to /var/lib/snapd/snap

When I install
sudo snap install phpstorm --classic
report an error:
error: cannot install “phpstorm”: classic confinement requires snaps under /snap or symlink from /snap to /var/lib/snapd/snap
Actually the reason is not adding soft links to /snap => /var/lib/snapd/snap
Solution:
sudo ln -s /var/lib/snapd/snap /snap

[Solved] Mybatis-config Error: Cannot load connection class because of underlying exception: com.mysql.cj.exceptions.WrongArgumentException: failed to parse the connection string near ‘;useUnicode=true&


situation:

If you want to transfer the db.properties data in the resource to mybatis config, there is an error running userdaotest

db.properties:

driver=com.mysql.jdbc.Driver
url=jdbc:mysql://localhost:3306/mybatis?useSSL=true&useUnicode=true&characterEncoding=UTF-8&serverTimezone=GMT
username=root
password=123456

mybatis-config.xml

<?xml version="1.0" encoding="utf8" ?>
<!DOCTYPE configuration
        PUBLIC "-//mybatis.org//DTD Config 3.0//EN"
        "http://mybatis.org/dtd/mybatis-3-config.dtd">

<configuration>
    <properties resource="db.properties" />

    <environments default="development">
        <environment id="development">
            <transactionManager type="JDBC"/>
            <dataSource type="POOLED">
                <property name="driver" value="${driver}"/>
                <property name="url" value="${url}"/>
                <property name="username" value="${username}"/>
                <property name="password" value="${password}"/>
            </dataSource>
        </environment>
    </environments>


    <mappers>
        <mapper resource="com/kuang/dao/UserMapper.xml"/>
    </mappers>
</configuration>

Errors are:

org.apache.ibatis.exceptions.PersistenceException: 
### Error querying database.  Cause: java.sql.SQLNonTransientConnectionException: Cannot load connection class because of underlying exception: com.mysql.cj.exceptions.WrongArgumentException: Malformed database URL, failed to parse the connection string near ';useUnicode=true&amp;characterEncoding=UTF-8&amp;serverTimezone=GMT'.
### The error may exist in com/kuang/dao/UserMapper.xml
### The error may involve com.kuang.dao.UserMapper.getUserLike
### The error occurred while executing a query
### Cause: java.sql.SQLNonTransientConnectionException: Cannot load connection class because of underlying exception: com.mysql.cj.exceptions.WrongArgumentException: Malformed database URL, failed to parse the connection string near ';useUnicode=true&amp;characterEncoding=UTF-8&amp;serverTimezone=GMT'.

According to the error information, locate the db.properties file and Baidu to the following link:

Mybatis configuration error cannot load connection class because of underlying exception: com.Mysql.CJ.Exceptions

Transfer the content of the properties tag of the xml file in mybatis to another external configuration file jdbcCondig.properties to report an error

I realized that the interpretation of && in the url part of the .properties file and the .xml database connection should be different. In the .xml file, && should be written as &
and in .properties it should be &&, so I put .xml The & in the url of the file is changed to && and it runs successfully.

Amend to read:

driver=com.mysql.jdbc.Driver
url=jdbc:mysql://localhost:3306/mybatis?useSSL=true&&useUnicode=true&&characterEncoding=UTF-8&&serverTimezone=GMT
username=root
password=123456

Solved.

[Solved] Git clone https:// gnutls_handshake() failed: The TLS connection was non-properly terminated.

This problem occurred to me especially behind corporate firewall after updating ubuntu to 18.04 LTS. I tried all possible approaches before coming across solution to compile GIT with openssl rather than gnutls. Copy+Pasting below that resolved the problem(Reference link: here)…

sudo apt-get update
sudo apt-get install build-essential fakeroot dpkg-dev libcurl4-openssl-dev
sudo apt-get build-dep git
mkdir ~/git-openssl
cd ~/git-openssl
apt-get source git
cd git-2.17.0/


vim debian/control    # replace all libcurl4-gnutls-dev with libcurl4-openssl-dev
vim debian/rules      # remove line "TEST =test" otherwise it takes longer to build the package


sudo dpkg-buildpackage -rfakeroot -b -uc -us   # add "-uc -us" to avoid error "gpg: No secret key"

sudo dpkg -i ../git_2.17.0-1ubuntu1_amd64.deb


Note 1: I got “OpenSSL SSL_connect: SSL_ERROR_SYSCALL in connection to proxy” when doing “git clone https://…” after steps above, which turns out to be a problem about git proxy setting. It can be fixed by:

git config --global http.proxy http://proxy.server.com:8080
git config --global https.proxy https://proxy.server.com:8080

Note that it’s better to verify the proxy & port works well first in browsers like Chrome. Reference link: here.
Note 2: I accidentally removed libcurl4-gnutls-dev when trying different approaches, unfortunately, lots of dependent libs are removed as well, including the network manager and GDM3. As a result, the network can’t work any more and the whole display UI was messed up(it switched to lightdm for display manager). I managed to fix the mess with “sudo apt install gdm3”. So as a lesson learn, don’t remove libcurl4-gnutls-dev for this issue.

Kafka Error: Caused by: java.lang.OutOfMemoryError: Map failed [How to Solve]

Record the oom error of Kafka once:

This is the case. I installed zookeeper and Kafka on my win10 for debugging.

The first start-up is OK. Both the consumer and production sides can operate normally.

Then, I tried to cycle the production data with code, and Kafka hung up.

Then I restart Kafka and it will never start again. Check the log of startup failure and report oom. The error contents are as follows:

[2021-11-07 20:16:13,683] ERROR Error while creating log for __consumer_offsets-41 in dir D:\software\kafka_2.11-1.1.0\logs (kafka.server.LogDirFailureChannel)
java.io.IOException: Map failed
    at sun.nio.ch.FileChannelImpl.map(FileChannelImpl.java:940)
    at kafka.log.AbstractIndex.<init>(AbstractIndex.scala:67)
    at kafka.log.OffsetIndex.<init>(OffsetIndex.scala:53)
    at kafka.log.LogSegment$.open(LogSegment.scala:560)
    at kafka.log.Log.loadSegments(Log.scala:412)
    at kafka.log.Log.<init>(Log.scala:216)
    at kafka.log.Log$.apply(Log.scala:1747)
    at kafka.log.LogManager$$anonfun$getOrCreateLog$1.apply(LogManager.scala:673)
    at kafka.log.LogManager$$anonfun$getOrCreateLog$1.apply(LogManager.scala:641)
    at scala.Option.getOrElse(Option.scala:121)
    at kafka.log.LogManager.getOrCreateLog(LogManager.scala:641)
    at kafka.cluster.Partition$$anonfun$getOrCreateReplica$1.apply(Partition.scala:177)
    at kafka.cluster.Partition$$anonfun$getOrCreateReplica$1.apply(Partition.scala:173)
    at kafka.utils.Pool.getAndMaybePut(Pool.scala:65)
    at kafka.cluster.Partition.getOrCreateReplica(Partition.scala:172)
    at kafka.cluster.Partition$$anonfun$6$$anonfun$8.apply(Partition.scala:259)
    at kafka.cluster.Partition$$anonfun$6$$anonfun$8.apply(Partition.scala:259)
    at scala.collection.TraversableLike$$anonfun$map$1.apply(TraversableLike.scala:234)
    at scala.collection.TraversableLike$$anonfun$map$1.apply(TraversableLike.scala:234)
    at scala.collection.Iterator$class.foreach(Iterator.scala:891)
    at scala.collection.AbstractIterator.foreach(Iterator.scala:1334)
    at scala.collection.IterableLike$class.foreach(IterableLike.scala:72)
    at scala.collection.AbstractIterable.foreach(Iterable.scala:54)
    at scala.collection.TraversableLike$class.map(TraversableLike.scala:234)
    at scala.collection.AbstractTraversable.map(Traversable.scala:104)
    at kafka.cluster.Partition$$anonfun$6.apply(Partition.scala:259)
    at kafka.cluster.Partition$$anonfun$6.apply(Partition.scala:253)
    at kafka.utils.CoreUtils$.inLock(CoreUtils.scala:250)
    at kafka.utils.CoreUtils$.inWriteLock(CoreUtils.scala:258)
    at kafka.cluster.Partition.makeLeader(Partition.scala:253)
    at kafka.server.ReplicaManager$$anonfun$makeLeaders$4.apply(ReplicaManager.scala:1165)
    at kafka.server.ReplicaManager$$anonfun$makeLeaders$4.apply(ReplicaManager.scala:1163)
    at scala.collection.mutable.HashMap$$anonfun$foreach$1.apply(HashMap.scala:130)
    at scala.collection.mutable.HashMap$$anonfun$foreach$1.apply(HashMap.scala:130)
    at scala.collection.mutable.HashTable$class.foreachEntry(HashTable.scala:236)
    at scala.collection.mutable.HashMap.foreachEntry(HashMap.scala:40)
    at scala.collection.mutable.HashMap.foreach(HashMap.scala:130)
    at kafka.server.ReplicaManager.makeLeaders(ReplicaManager.scala:1163)
    at kafka.server.ReplicaManager.becomeLeaderOrFollower(ReplicaManager.scala:1083)
    at kafka.server.KafkaApis.handleLeaderAndIsrRequest(KafkaApis.scala:183)
    at kafka.server.KafkaApis.handle(KafkaApis.scala:108)
    at kafka.server.KafkaRequestHandler.run(KafkaRequestHandler.scala:69)
    at java.lang.Thread.run(Thread.java:745)
Caused by: java.lang.OutOfMemoryError: Map failed
    at sun.nio.ch.FileChannelImpl.map0(Native Method)
    at sun.nio.ch.FileChannelImpl.map(FileChannelImpl.java:937)
    ... 42 more
[2021-11-07 20:16:13,689] INFO [ReplicaManager broker=0] Stopping serving replicas in dir D:\software\kafka_2.11-1.1.0\logs (kafka.server.ReplicaManager)
[2021-11-07 20:16:13,693] ERROR [ReplicaManager broker=0] Error while making broker the leader for partition Topic: __consumer_offsets; Partition: 41; Leader: None; AllReplicas: ; InSyncReplicas:  in dir None (kafka.server.ReplicaManager)
org.apache.kafka.common.errors.KafkaStorageException: Error while creating log for __consumer_offsets-41 in dir D:\software\kafka_2.11-1.1.0\logs
Caused by: java.io.IOException: Map failed
    at sun.nio.ch.FileChannelImpl.map(FileChannelImpl.java:940)
    at kafka.log.AbstractIndex.<init>(AbstractIndex.scala:67)
    at kafka.log.OffsetIndex.<init>(OffsetIndex.scala:53)
    at kafka.log.LogSegment$.open(LogSegment.scala:560)
    at kafka.log.Log.loadSegments(Log.scala:412)
    at kafka.log.Log.<init>(Log.scala:216)
    at kafka.log.Log$.apply(Log.scala:1747)
    at kafka.log.LogManager$$anonfun$getOrCreateLog$1.apply(LogManager.scala:673)
    at kafka.log.LogManager$$anonfun$getOrCreateLog$1.apply(LogManager.scala:641)
    at scala.Option.getOrElse(Option.scala:121)
    at kafka.log.LogManager.getOrCreateLog(LogManager.scala:641)
    at kafka.cluster.Partition$$anonfun$getOrCreateReplica$1.apply(Partition.scala:177)
    at kafka.cluster.Partition$$anonfun$getOrCreateReplica$1.apply(Partition.scala:173)
    at kafka.utils.Pool.getAndMaybePut(Pool.scala:65)
    at kafka.cluster.Partition.getOrCreateReplica(Partition.scala:172)
    at kafka.cluster.Partition$$anonfun$6$$anonfun$8.apply(Partition.scala:259)
    at kafka.cluster.Partition$$anonfun$6$$anonfun$8.apply(Partition.scala:259)
    at scala.collection.TraversableLike$$anonfun$map$1.apply(TraversableLike.scala:234)
    at scala.collection.TraversableLike$$anonfun$map$1.apply(TraversableLike.scala:234)
    at scala.collection.Iterator$class.foreach(Iterator.scala:891)
    at scala.collection.AbstractIterator.foreach(Iterator.scala:1334)
    at scala.collection.IterableLike$class.foreach(IterableLike.scala:72)
    at scala.collection.AbstractIterable.foreach(Iterable.scala:54)
    at scala.collection.TraversableLike$class.map(TraversableLike.scala:234)
    at scala.collection.AbstractTraversable.map(Traversable.scala:104)
    at kafka.cluster.Partition$$anonfun$6.apply(Partition.scala:259)
    at kafka.cluster.Partition$$anonfun$6.apply(Partition.scala:253)
    at kafka.utils.CoreUtils$.inLock(CoreUtils.scala:250)
    at kafka.utils.CoreUtils$.inWriteLock(CoreUtils.scala:258)
    at kafka.cluster.Partition.makeLeader(Partition.scala:253)
    at kafka.server.ReplicaManager$$anonfun$makeLeaders$4.apply(ReplicaManager.scala:1165)
    at kafka.server.ReplicaManager$$anonfun$makeLeaders$4.apply(ReplicaManager.scala:1163)
    at scala.collection.mutable.HashMap$$anonfun$foreach$1.apply(HashMap.scala:130)
    at scala.collection.mutable.HashMap$$anonfun$foreach$1.apply(HashMap.scala:130)
    at scala.collection.mutable.HashTable$class.foreachEntry(HashTable.scala:236)
    at scala.collection.mutable.HashMap.foreachEntry(HashMap.scala:40)
    at scala.collection.mutable.HashMap.foreach(HashMap.scala:130)
    at kafka.server.ReplicaManager.makeLeaders(ReplicaManager.scala:1163)
    at kafka.server.ReplicaManager.becomeLeaderOrFollower(ReplicaManager.scala:1083)
    at kafka.server.KafkaApis.handleLeaderAndIsrRequest(KafkaApis.scala:183)
    at kafka.server.KafkaApis.handle(KafkaApis.scala:108)
    at kafka.server.KafkaRequestHandler.run(KafkaRequestHandler.scala:69)
    at java.lang.Thread.run(Thread.java:745)
Caused by: java.lang.OutOfMemoryError: Map failed
    at sun.nio.ch.FileChannelImpl.map0(Native Method)
    at sun.nio.ch.FileChannelImpl.map(FileChannelImpl.java:937)
    ... 42 more
[2021-11-07 20:16:13,836] ERROR Error while creating log for __consumer_offsets-32 in dir D:\software\kafka_2.11-1.1.0\logs (kafka.server.LogDirFailureChannel)

Resolution process,

First, try to restart Kafka, delete Kafka logs, restart zookeeper, or even shut down and restart windows.

Log path of Kafka:% Kafka_Log. Dirs = logs in home%\config\server.people

Then, find a solution on the Internet, modify the JVM parameters in kafka-server-start.bat, and change the two 1gs to 512M. As a result, Kafka can start for a while, but hang up immediately.

Finally, through observation, it is found that every time Kafka is restarted, a pile of files will be generated under logs (and it is confirmed that I manually deleted them before each startup). It is strange that I don’t know where these data are cached. Finally, delete all the logs under logs in zookeeper.

Log path of zookeeper: dataDir = D:/logs/zookeeper in% zookeeper% conf\zoo.cfg

Conclusion: the main reason for the oom of Kafka at startup is that the data is cached in the dependent zookeeper. feel surprised? feel off-guard?