Two days ago, I met such a strange phenomenon: when I send an HTTP request to a service, there will be packet loss in probability
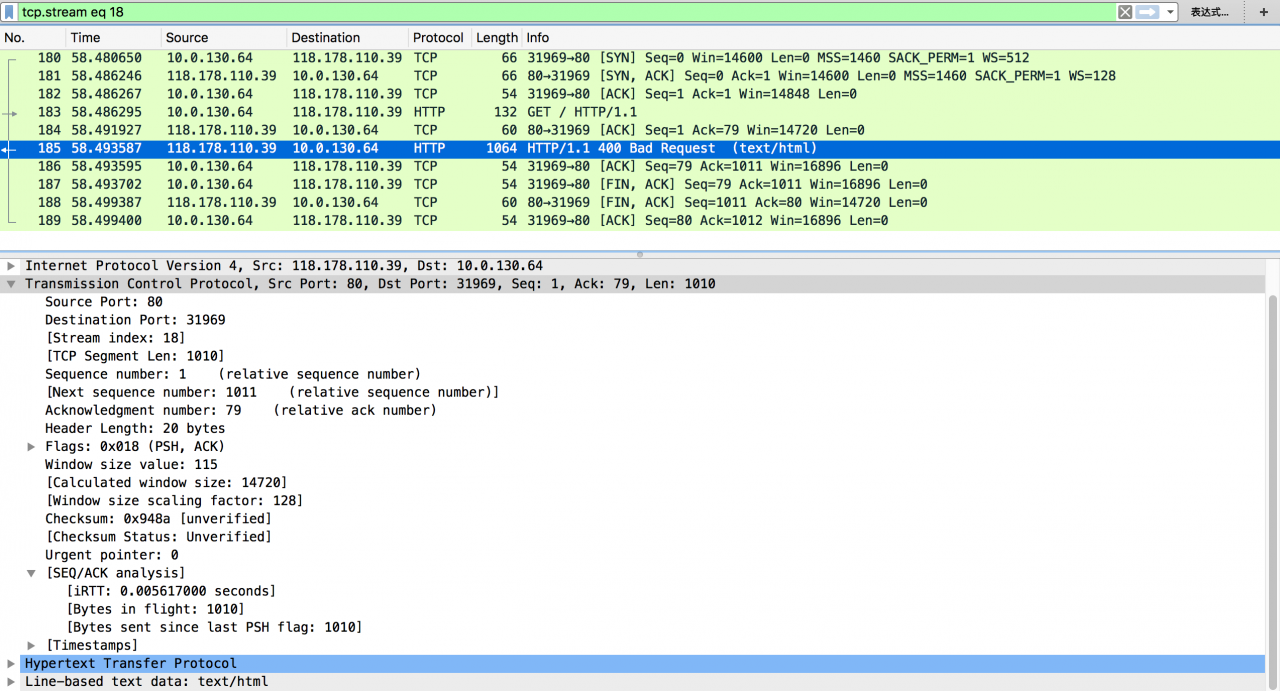
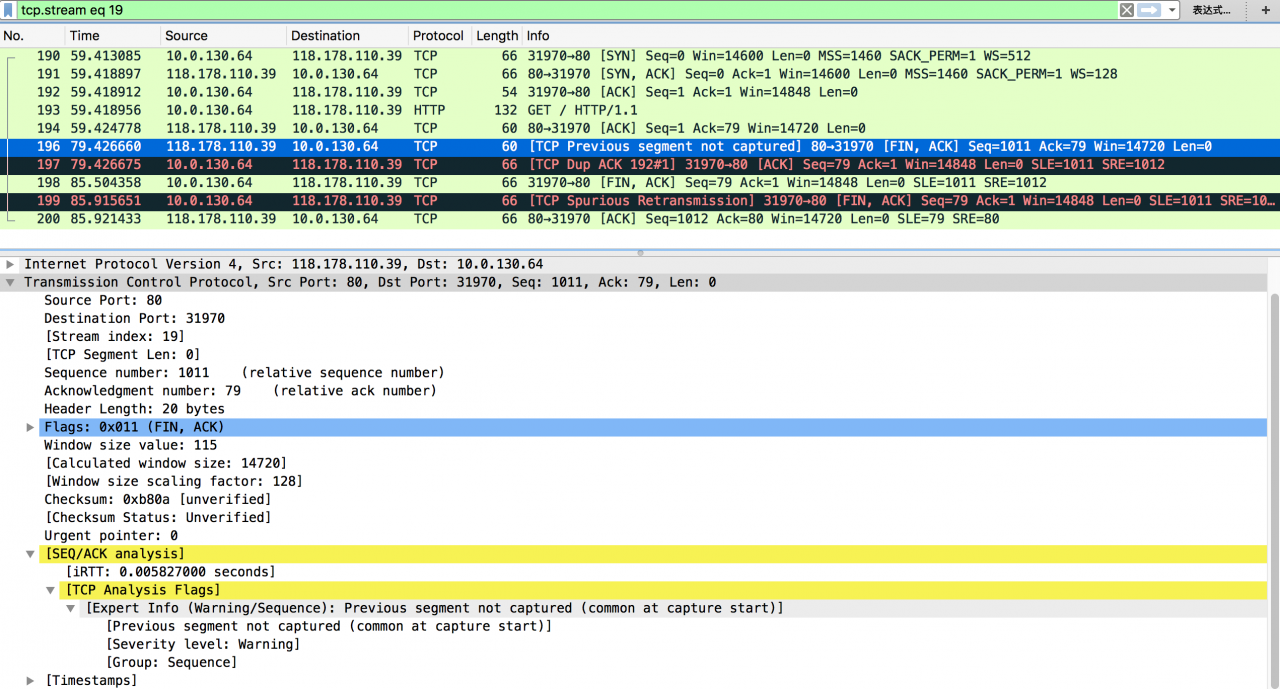
The screenshot is as follows:

Under normal circumstances, the server will respond quickly after receiving the HTTP request, and the TCP connection closure is initiated by the client side

In abnormal cases, we can see that the server actively closes the TCP connection after 20 seconds, and Wireshark’s expert information tells us that there are packets that have not been captured (TCP previous segment not captured)
It should be noted that: the above two screenshots are captured during continuous testing through curl, and the recurrence probability of the problem is very high; because the server is in the cloud, it can only perform packet capture analysis on the local client side
For the abnormal data packets, the analysis is as follows:
Packet No. 196 indicates that the server thinks that it has completed the service request, but the client does not actively close the connection, so it has to actively close the connection after 20 seconds; packet No. 196 shows “TCP previous segment not captured” and “SEQ = 1011” in the packet, while the last server side packet we caught needs to be “SEQ = 1”, indicating that there is 1010 in it We didn’t catch the byte packet
Package 197 indicates that the client thinks that it has received a packet out of order after receiving “SEQ = 1011”, so it tries to make the server retransmit the missing 1010 sub section through “TCP DUP ACK 192#1” and “ack = 1”
Package 198 indicates that the client found that package 196 carried the “fin” flag, so (after about 6S) the connection was closed after four handshakes
Packet No. 199 indicates that the client has also conducted a “TCP spurious retransmission” for “fin” for some reason
From the above analysis, it can be seen that although there are several abnormal packets, the most critical one is “TCP previous segment not captured”, because the problem is probabilistic, and the packet size is also conventional. In addition, according to relevant personnel, there is no CPU on the server side And the network card traffic is also in the normal range. Therefore, the problem looks like intermittent “exhaust”. Then, what situation will lead to the appearance of “TCP previous segment not captured”?
During packet capture analysis, you may see the following information:
Capturing packets in the middle stage of TCP session leads to the loss of some information
The speed of packet capture cannot meet the speed of packet arrival (it can be adjusted by capture filter)
Switches, routers and firewalls can cause the above problems in some cases
Antivirus software and malware monitoring program may also cause the above problems
There may be some bugs in the old TCP stack
In addition, according to the official website of Wireshark, there are the following explanations:
TCP Previous segment lost – Occurs when a packet arrives with a sequence number greater than the “next expected sequence number” on that connection, indicating that one or more packets prior to the flagged packet did not arrive. This event is a good indicator of packet loss and will likely be accompanied by “TCP Retransmission” events.
In a word, the cause of the problem can not be determined at present, but it is suspected that it is related to the firewall and other equipment, and the conclusion will be updated after further progress
General analysis instructions found on the Internet
As described by the alarm information, this is often the case when the packet capture behavior starts in the middle stage of a TCP session. If the real situation is caused by the loss of acks, you need to check how the packet is lost relative to the upstream of your host
It is very likely that tshark’s packet capture speed can’t keep up with the speed of packet arrival, and then, of course, some metrics will be lost; when packet capture stops, there will be corresponding information to tell you whether there is a situation of “ kernel dropped packet ” and drop By default, tshark will disable DNS queries, while tcpdump will not; if you use tcpdump to capture packets, you need to use “- n” switch to disable DNS queries to reduce overhead; if you are faced with insufficient disk IO, you can write the contents of packet capture to/dev/SHM But this usage needs to be careful, because once the content of the packet is too large, it will lead the machine into the swapping dilemma
A common situation is that if your application uses some long-running TCP sessions, some information of these TCP sessions will be lost when the subsequent packet capture behavior is started
Specifically, some typical situations that I have seen and lead to duplicate/missing acks are as follows:
switches – it is not possible in general, but sometimes the switch is in the sick state
routes – it is more likely than the switch to have problems, but it is not very high
firewall – it is more likely than router to have problems, and the common reasons are related to resource exhaustion (license, CPU, etc.)
client side filtering software – anti virus software, malware detection software, etc
If all network traffic is captured in unfiltered mode on busy interface, a large number of packets will be displayed as “dropped” when tshark is stopped, because in this case, tshark needs to sort all captured packets; once an appropriate capture filter is set to reduce the capture of non target packets, there will be a problem The probability of ‘dropped’ is greatly reduced
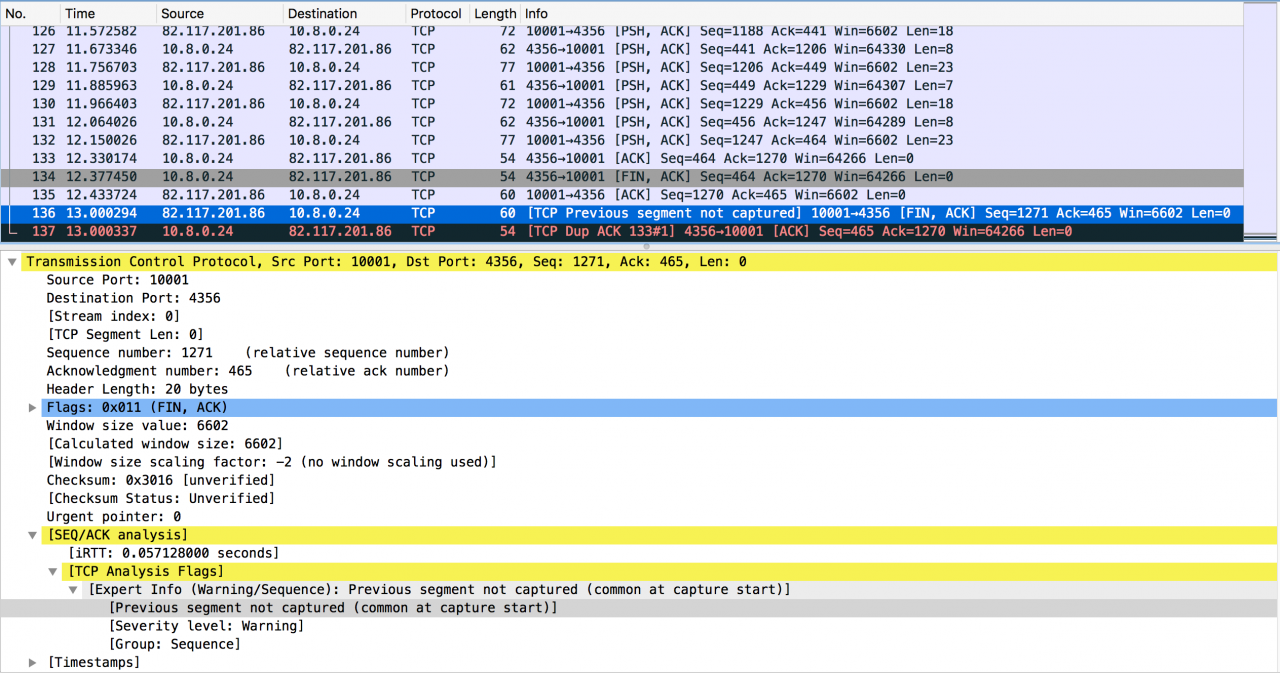
The following figure is a special case given by netizens: serial number error caused by TCP stack bug

Package address: here
It is obvious from the above packet capture that the packet from server address 82.117.201.86 does not follow the TCP RFC protocol stack implementation: when closing the TCP session, the fin packet should carry the next expected sequence packet, and when the fin packet is acked, the corresponding ACK packet needs to be one byte occupied by the fin However, the actual situation of the above packet is that the sequence number in the fin packet sent by the server has exceeded the length of one byte; this behavior is obviously wrong, so the client correctly sends a duplicate ack to request the packet with the correct sequence number
Therefore, the possible reasons for the above packet capture are either that a byte of data is sent and then lost, or that there is a bug in the TCP stack on the server side
“TCP previous segment not captured” is the expert information provided by Wireshark software, which is used to inform that some packets are missing in the current packet capture. The alarm information was described as “TCP previous segment lost” before. The basic meaning of the alarm is: either the packet does not appear (packet loss), or Wireshark The action of catching bags is not fast enough to record the arrival of bags
Reference article:
Understanding [TCP ACKed unseen segment] [TCP Previous segment not captured]
TCP previous segment not captured, why?
Similar Posts:
- #TCP you can learn “TCP spurious retransmission” in Wireshark
- TCP segment of a reassembled PDU
- Code a packet sniffer in python with pcapy exte…
- About Wireshark “the NPF driver isn’t running “Solutions
- WebSocket Error: Unable to unwrap data, invalid status [CLOSED]
- OPENVPN TLS Error: TLS key negotiation failed
- SSL / TLS packet capture prompts ignored unknown record
- [How to Solve] Lost connection to MySQL server at ‘reading i…
- error: only position independent executables (PIE) are supported.
- HTTP status code 499 [How to Solve]