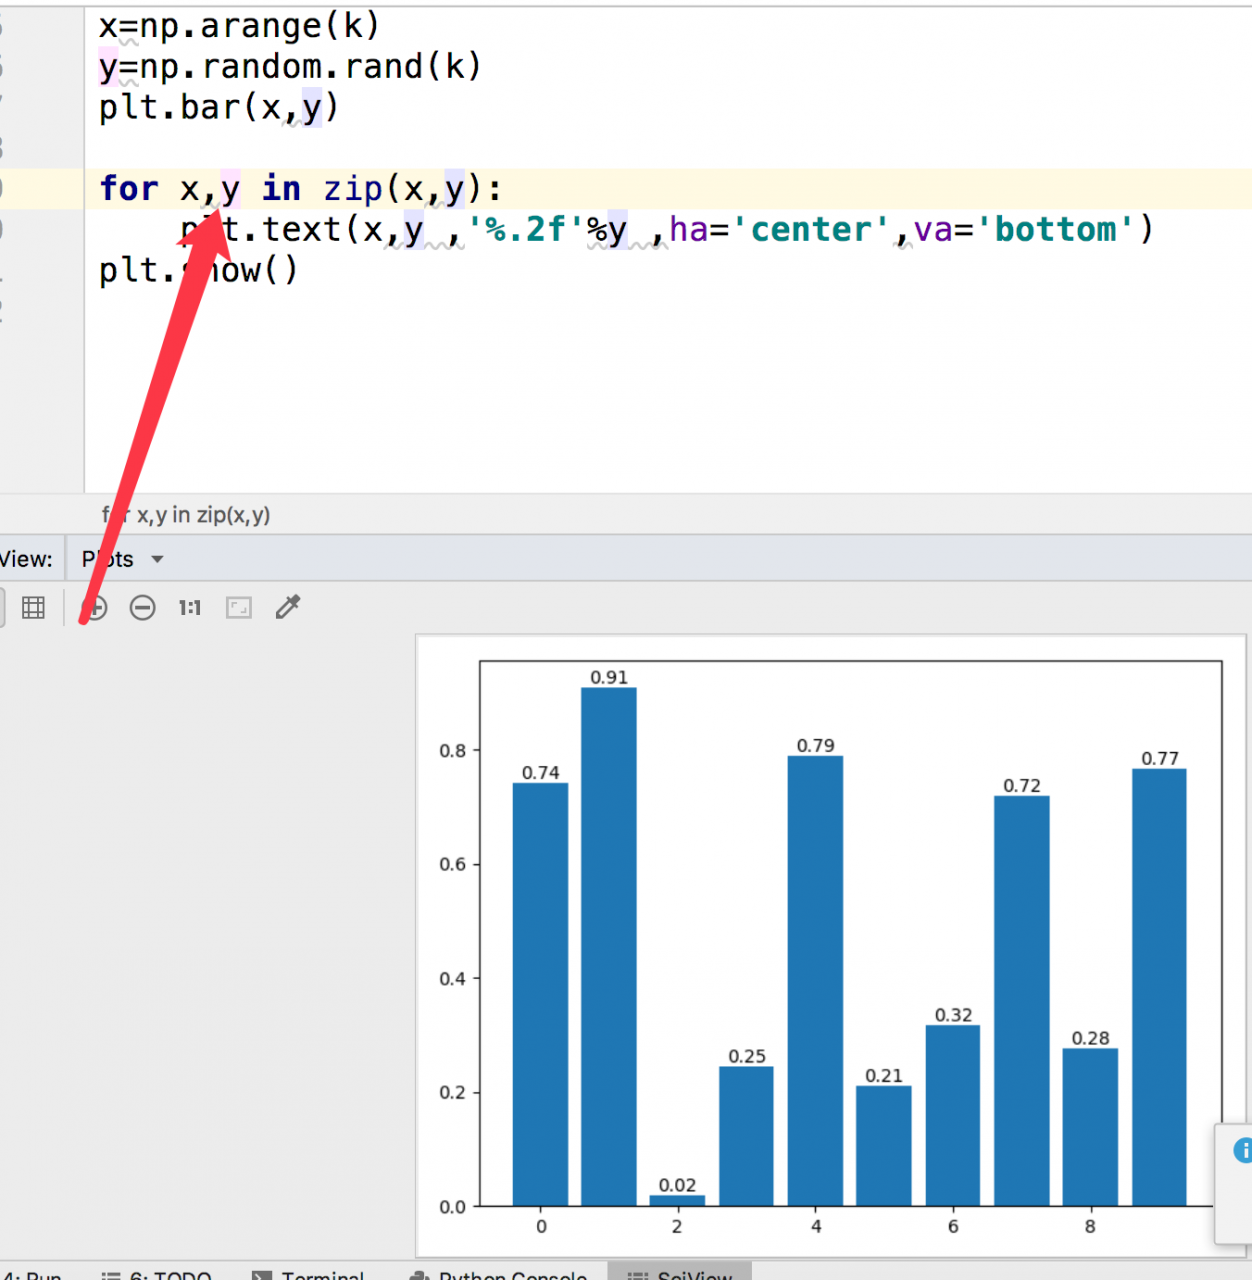
Traceback (most recent call last):
File “/Users/mac126/111/mayplotlib/mayplotlib.py”, line 50, in <module>
plt.text(x,y ,’%.2f’%y ,ha=’center’,va=’bottom’)
TypeError: only size-1 arrays can be converted to Python scalars
code
import matplotlib.pyplot as plt
import numpy as np
k=10
x=np.arange(k)
y=np.random.rand(k)
plt.bar(x,y)

for x in zip(x,y):
    plt.text(x,y ,'%.2f'%y ,ha='center',va='bottom')
plt.show()
It’s found that one parameter Y is missing and it’s OK to add it

Similar Posts:
- only size-1 arrays can be converted to Python scalars
- [Solved] Pycharm Error: Error: failed to send plot to http://127.0.0.1:63342
- [Solved] Python TensorFlow Error: ‘tensorflow.compat.v2.__internal__’ has no attribute ‘tf2’
- RuntimeError: Python is not installed as a framework [How to Solve]
- Solve the problem of attributeerror: module ‘Matplotlib’ has no attribute ‘verb
- [Solved] Importerror: DLL load failed while importing mtrand: the specified program could not be found.
- [Solved] pydotplus generate iris.pdf error: InvocationException: GraphViz’s executables not found
- TypeError: Image data of dtype object cannot be converted to float
- ImportError: No module named matplotlib.pyplot