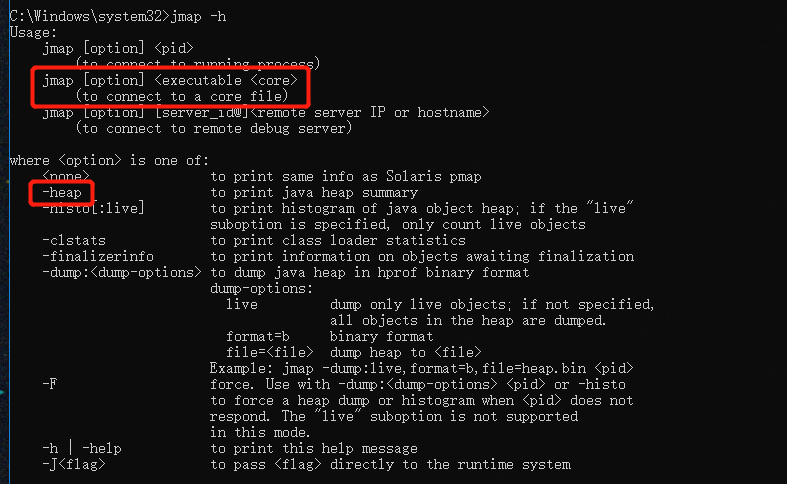
Recently, I changed my laptop. In the new working environment, the jmap command is actually reporting errors, and JPS, jstat, Jinfo and jstack can be used normally. Therefore, the problem of process number is preliminarily eliminated
Attaching to core 17536 from executable heap, please wait...
Error attaching to core file: Windbg Error: OpenDumpFile failed!
sun.jvm.hotspot.debugger.DebuggerException: Windbg Error: OpenDumpFile failed!
        at sun.jvm.hotspot.debugger.windbg.WindbgDebuggerLocal.attach0(Native Method)
        at sun.jvm.hotspot.debugger.windbg.WindbgDebuggerLocal.attach(WindbgDebuggerLocal.java:160)
        at sun.jvm.hotspot.HotSpotAgent.attachDebugger(HotSpotAgent.java:673)
        at sun.jvm.hotspot.HotSpotAgent.setupDebuggerWin32(HotSpotAgent.java:569)
        at sun.jvm.hotspot.HotSpotAgent.setupDebugger(HotSpotAgent.java:335)
        at sun.jvm.hotspot.HotSpotAgent.go(HotSpotAgent.java:304)
        at sun.jvm.hotspot.HotSpotAgent.attach(HotSpotAgent.java:156)
        at sun.jvm.hotspot.tools.Tool.start(Tool.java:191)
        at sun.jvm.hotspot.tools.Tool.execute(Tool.java:118)
        at sun.jvm.hotspot.tools.PMap.main(PMap.java:72)
        at sun.reflect.NativeMethodAccessorImpl.invoke0(Native Method)
        at sun.reflect.NativeMethodAccessorImpl.invoke(NativeMethodAccessorImpl.java:62)
        at sun.reflect.DelegatingMethodAccessorImpl.invoke(DelegatingMethodAccessorImpl.java:43)
        at java.lang.reflect.Method.invoke(Method.java:498)
        at sun.tools.jmap.JMap.runTool(JMap.java:201)
        at sun.tools.jmap.JMap.main(JMap.java:130)
At the same time, I tried jmap heap XXX a non-existent process number (a pit is buried here first), but still reported the same error. According to the information of the exception stack, it is suspected that the command line under Windows does not have administrator permissions and cannot access the dump file, so I tried to run CMD as an administrator, and then jmap heap, However, the same mistake is reported:

I’m helpless now. Baidu and stackoverflow haven’t found a solution to the problem after walking around… Let’s go first
gorgeous separation line
I don’t know how long later, I suddenly remembered — “didn’t you hit the right command?” jmap – H take a look at the red box in the screenshot, and then lower your head in shame (it must be caused by eating too many mid autumn moon cakes, huh!)

as shown in the figure, jmap has three uses: 1. Connect the running process; 2. Analyze the core file, that is, dump file; 3. Connect the JVM processes of other machines. Therefore, the problem with the jmap heap XXX command above is that you forget to add “-” and jmap is regarded as analyzing the snapshot file of “heap”, and it is natural to report an error
Summary:
In JDK’s own toolkit, for commands such as JPS, jmap, jstack, etc., specifying option generally requires “-” and the following parameters do not contain bars, which should be kept in mind. And make complaints about the exception. Don’t panic. You must read the abnormal information and abnormal stack carefully. In this case, the first line has already been clear. (if you put the filename out, you can print it out better)
Similar Posts:
- jhsdb jmap –heap –pid 1 Command Error [How to Solve]
- How to Solve JAVA Error: “well-known file is not secure” ?
- [JVM] Linux calls jmap and reports an error permission denied
- [Solved] org.apache.catalina.LifecycleException: Failed to start component
- java.lang.UnsatisfiedLinkError: no rxtxSerial in java.library.path
- [Solved] org.hibernate.MappingException: Unknown entity
- [Solved] Hadoop Error: Input path does not exist: hdfs://Master:9000/user/hadoop/input
- Eclipse failed to start. Javax / annotation / postconstruct is missing
- [Solved] Error configuring application listener of class [org.springframework.web.util.Log4jConfigListener]
- SpringMvc Error:java.lang.IllegalStateException