Debug
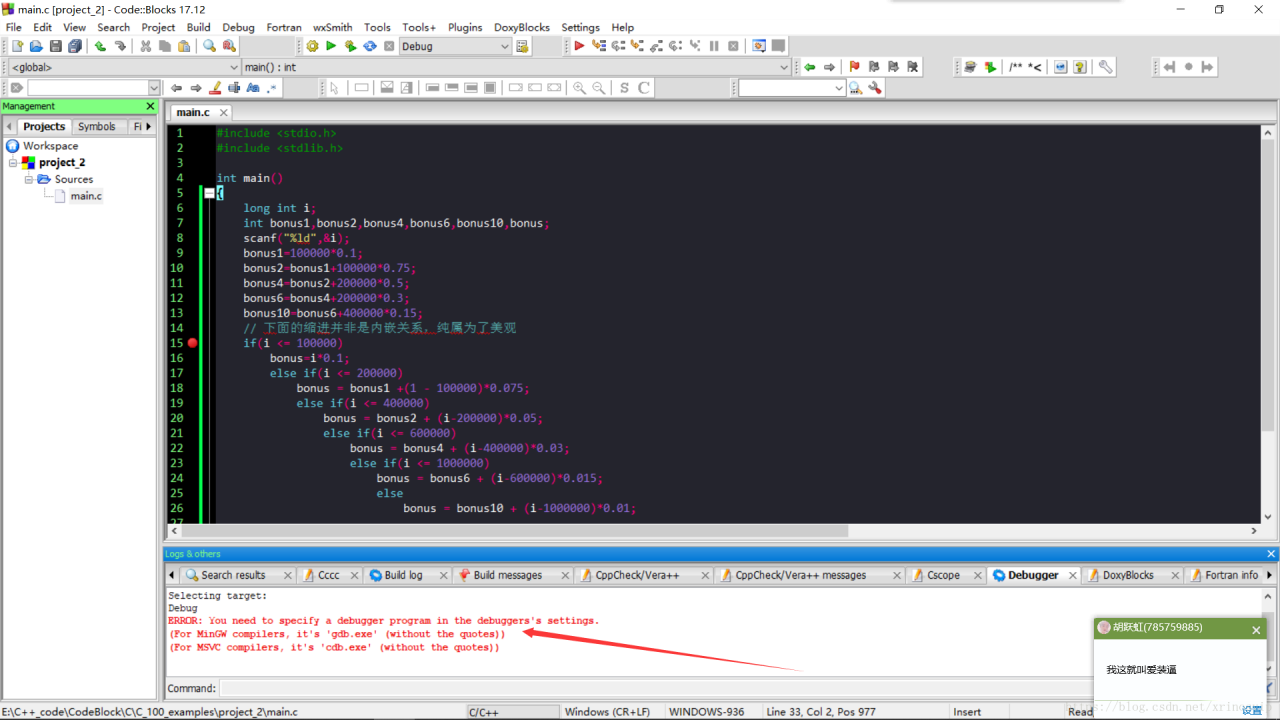
ERROR: You need to specify a debugger program in the debuggers’s settings.
(For MinGW compilers, it’s ‘gdb.exe’ (without the quotes))
(For MSVC compilers, it’s ‘cdb.exe’ (without the quotes))

Find configurations online at
1:https://stackoverflow.com/questions/21083560/how-do-you-specify-a-debugger-program-in-codeblocks-12-11/33289596
Sorted out, but it will appear that it can only be run once:
Solution reference: http://tieba.baidu.com/p/3491019377
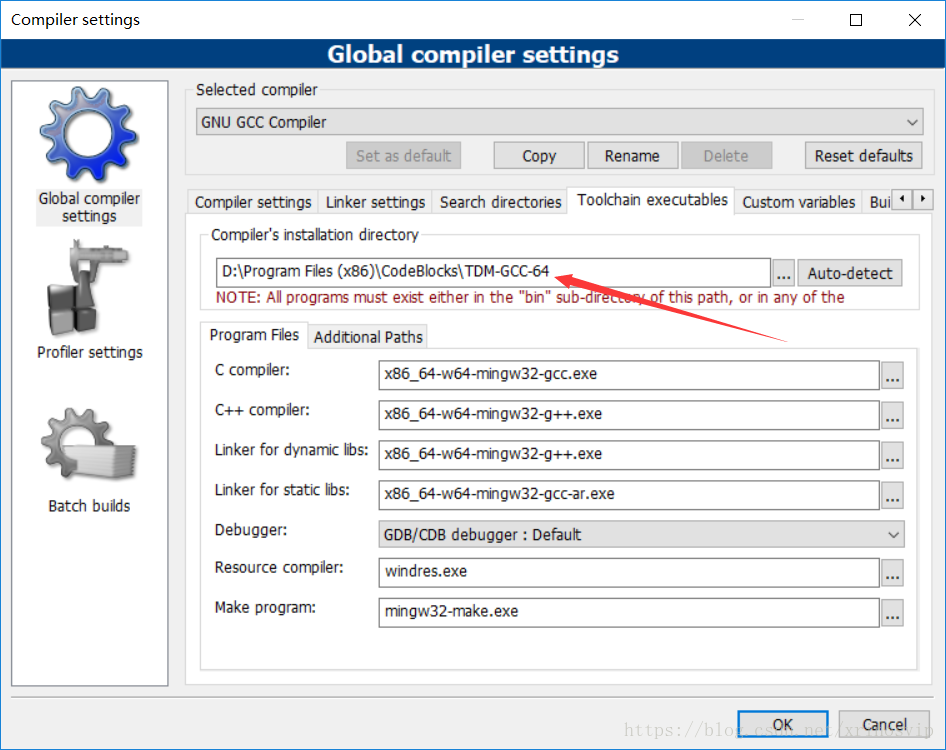
Compiler configuration.
Note: The compiler is not Codeblocks’ own MinGW, but TDM-GCC-64 !!!!!!

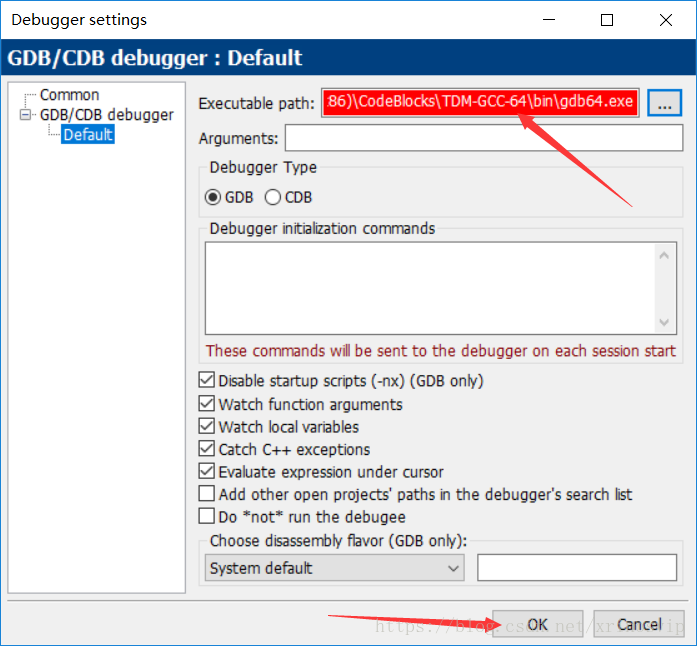
Executable path:D:\Program Files (x86)\CodeBlocks\TDM-GCC-64\bin\gdb64.exe (Here is the compiler installation path, note: 32-bit system choose gdb.exe, 64-bit system choose: gdb64.exe)

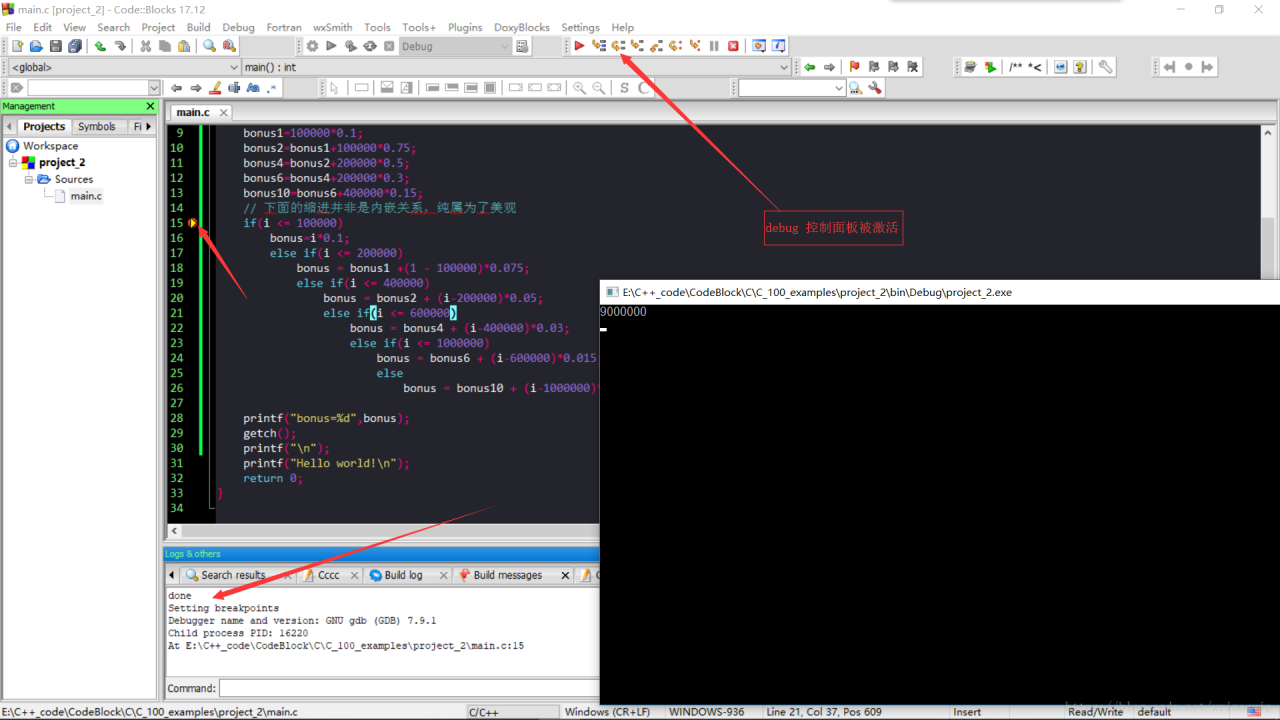
Run the completed debug interface.

Similar Posts:
- [Solved] Go Gcc Compilation Error: gcc.exe fatal error no input files compilation terminated
- Python error: Unable to find vcvarsall.bat [How to Solve]
- When executing the vacuum SSH command, ‘SSH’ executable not found in any directions in the% path%. Solution to the prompt
- [Solved] cc1plus.exe: out of memory allocating bytes
- Cannot find bounds of current function
- Installing mingw64 and msys2 in win10
- The solution of Python extension problem “unable to find vcvarsall. Bat”
- [Solved] codeblocks Error: ‘to_string’ was not declared in this scope
- CMake: How to Complie Log4cplus
- VSCode debugging go language appears: exec: “gcc”: executable file not found in %PATH%