Complete code
<template>
<div class="animated fadeIn" style="background-color: white">
<Row>
<div ref="chinaMap" id="chinaMap"></div>
</Row>
</div>
</template>
<script>
// import echarts from 'echarts'
import * as echarts from 'echarts';
import 'echarts/map/js/china.js';
export default {
name: "ChinaMap",
data () {
return {
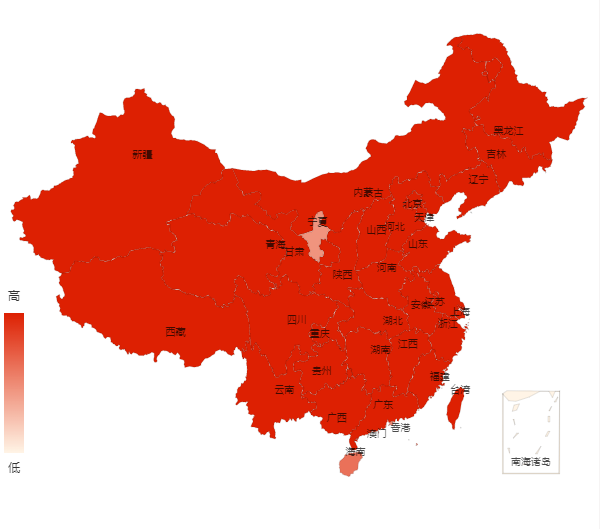
dataList:[
{name: '南海诸岛', value: 0},
{name: '北京', value: 2170.7},
{name: '天津', value: 1559.6},
{name: '上海', value: 2423.78},
{name: '重庆', value: 3048.43},
{name: '河北', value: 7556.3},
{name: '河南', value: 9605},
{name: '云南', value: 4800.5},
{name: '辽宁', value: 4359.3},
{name: '黑龙江', value: 3788.7},
{name: '湖南', value: 6860.2},
{name: '安徽', value: 6323.6},
{name: '山东', value: 10047.2},
{name: '新疆', value: 2444.67},
{name: '江苏', value: 8029.3},
{name: '浙江', value: 5737},
{name: '江西', value: 4622.1},
{name: '湖北', value: 5917},
{name: '广西', value: 4885},
{name: '甘肃', value: 2625.71},
{name: '山西', value: 3702.35},
{name: '内蒙古', value: 2534},
{name: '陕西', value: 3835.44},
{name: '吉林', value: 2717.43},
{name: '福建', value: 3941},
{name: '贵州', value: 3580},
{name: '广东', value: 11346},
{name: '青海', value: 3983.8},
{name: '西藏', value: 3371.5},
{name: '四川', value: 8341},
{name: '宁夏', value: 681.79},
{name: '海南', value: 925.76},
{name: '台湾', value: 2369},
{name: '香港', value: 748.25},
{name: '澳门', value: 63.2}
]
}
},
methods: {
buildMap(){
let myChart = echarts.init(this.$refs.chinaMap);
let option = {
tooltip: {
formatter:function(params){
return params.seriesName+'<br />'+params.name+':'+params.value
}
},
visualMap: {
min: 0,
max: 1500,
left: 'left',
top: 'bottom',
text: ['Hight','Low'],
inRange: {
color: ['#fff4e6', '#dd2002']
},
show:true
},
geo: {
map: 'china',
roam: false,
zoom:1.23,
label: {
normal: {
show: true,
fontSize:'10',//Note: If the map province name font is too large will lead to font overlap
color: 'rgba(0,0,0,0.7)'
}
},
itemStyle: {
normal:{
borderColor: 'rgba(0, 0, 0, 0.2)'
},
emphasis:{
areaColor: '#F3B329',//Mouse to select area color
shadowOffsetX: 0,
shadowOffsetY: 0,
shadowBlur: 20,
borderWidth: 0,
shadowColor: 'rgba(0, 0, 0, 0.5)'
}
}
},
series : [
{
name: 'Messages',
type: 'map',
geoIndex: 0,
data:this.dataList
}
]
};
myChart.setOption(option);
}
},
mounted() {
this.buildMap()
}
}
</script>
<style scoped>
*{margin:0;padding:0}
html,body{
width:100%;
height:100%;
}
#chinaMap{
width:600px;
height:450px;
margin: 150px auto;
border:none;
}
</style>
The geojson of the map must be provided
echarts/map/js/china.js in ./node_modules/cache-loader/dist/cjs.js??ref–13-0!./node_modules/babel-loader/lib!./node_modules/cache-loader/dist/cjs.js??ref–1-0!./nod e_modules/vue-loader/lib??vue-loader-options!./src/components/ChinaMap.vue?vue&type
Reason: the version of ecarts is too high. The vector map data previously provided by ecarts is from a third party. Because some data do not comply with the provisions of the national surveying and Mapping Law, the download service is temporarily suspended.
Solution: download the lower version [email protected]
npm ls echarts  // Check your version of echarts
npm install [email protected] --save  //Download the lower version echats contain china.js
Directly reducing the version may affect other icons. Multiple ecarts versions can be introduced at the same time
Similar Posts:
- [Solved] Vue Import echarts Error: export ‘default‘ (imported as ‘echarts‘) was not found in ‘echarts‘
- [Solved] Vue Import echarts error: Error in mounted hook: “TypeError: Cannot read property ‘init’ of undefined”
- [Solved] Error: `resize` should not be called during main process.
- [Solved] Syntax Error: SassError: semicolons aren’t allowed in the indented syntax.
- How to Copy Echarts Map Examples to Local vueCLI Project (Commissioning Operation)
- ECharts Error: Uncaught Error: `setOption` should not be called during main process
- export ‘default’ (imported as ‘mod’) was not found in ‘-!../../../../node_module .vue?vue&type=script&lang=ts&’ (possible exports: __esModule)
- [Solved] Echarts 2 & 3 Error: Cannot read property ‘features’ of undefined
- [Solved] Module build failed: Error: Cannot find module ‘node-sass’
- [Solved] Vue Install Less Error: npm ERR! code ERESOLVE