Oracle uses errorstack to track the ora error of the client
preface
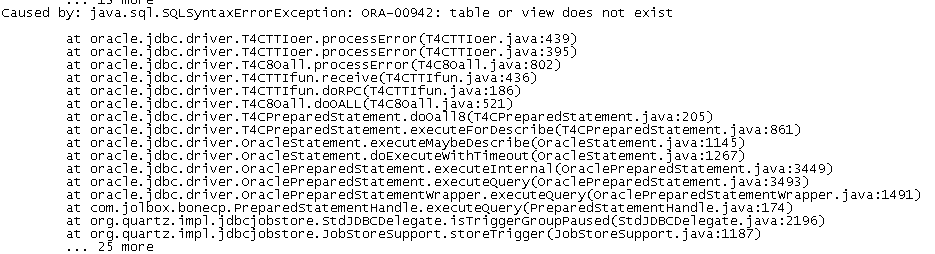
Recently, a business module reported an error ora-00942: table or view doors not exist. I want to help find out which SQL is causing it.
Generally, if the ora error of the client is simply caused by the client, such ora error will not be recorded in the database server.
For example, if an error is reported when the table or view does not exist, if the client deliberately checks a non-existent table and performs a large number of operations, considering concurrency, if the server records logs, a large number of logs will be generated.
Or when the client executes an SQL with syntax errors, such as ora-00936: missing expression, the same is true.
However, you can use the errorstack switch to turn on the monitoring of an ora error number and turn it off after obtaining enough information.
experiment
Take the ora-00942 error report as an example, use the sys user to turn on the monitoring switch with error number 942.
15:23:27 SYS@test(1218)> alter system set events '942 trace name errorstack forever, level 3';

System altered.

Elapsed: 00:00:00.00
Warning log at this time:
Thu Sep 30 15:25:47 2021
OS Pid: 21259 executed alter system set events '942 trace name errorstack forever, level 3'
Then ordinary users log in and execute a query to query a non-existent table.
15:23:17 ZKM@test(432)> select * from no;
select * from no
              *
ERROR at line 1:
ORA-00942: table or view does not exist


Elapsed: 00:00:04.16
Warning log at this time:
Thu Sep 30 15:27:47 2021
Errors in file /u01/app/oracle/diag/rdbms/test/test/trace/test_ora_21173.trc:
Errors in file /u01/app/oracle/diag/rdbms/test/test/trace/test_ora_21173.trc:
ORA-00942: table or view does not exist
Thu Sep 30 15:27:49 2021
Dumping diagnostic data in directory=[cdmp_20210930152749], requested by (instance=1, osid=21173), summary=[abnormal process termination].
Dumping diagnostic data in directory=[cdmp_20210930152752], requested by (instance=1, osid=21173), summary=[abnormal process termination].
Turn off the switch in time:
15:30:45 SYS@test(1218)> alter system set events '942 trace name errorstack off';

System altered.

Elapsed: 00:00:00.00
To view the trace file:
Trace file /u01/app/oracle/diag/rdbms/test/test/trace/test_ora_21173.trc
Oracle Database 11g Enterprise Edition Release 11.2.0.4.0 - 64bit Production
With the Partitioning, OLAP, Data Mining and Real Application Testing options
ORACLE_HOME = /u01/app/oracle/product/11.2.0/db_1
System name:    Linux
Node name:      testdb
Release:        5.4.17-2011.6.2.el7uek.x86_64
Version:        #2 SMP Thu Sep 3 14:09:14 PDT 2020
Machine:        x86_64
VM name:        VMWare Version: 6
Instance name: test
Redo thread mounted by this instance: 1
Oracle process number: 129
Unix process pid: 21173, image: oracle@testdb (TNS V1-V3)


*** 2021-09-30 15:27:47.079
*** SESSION ID:(432.4017) 2021-09-30 15:27:47.079
*** CLIENT ID:() 2021-09-30 15:27:47.079
*** SERVICE NAME:(SYS$USERS) 2021-09-30 15:27:47.079
*** MODULE NAME:(SQL*Plus) 2021-09-30 15:27:47.079
*** ACTION NAME:() 2021-09-30 15:27:47.079

dbkedDefDump(): Starting a non-incident diagnostic dump (flags=0x0, level=3, mask=0x0)
----- Error Stack Dump -----
----- Current SQL Statement for this session (sql_id=2611xga5f8w95) -----
select * from no

----- Call Stack Trace -----
calling              call     entry                argument values in hex
location             type     point                (?means dubious value)
-------------------- -------- -------------------- ----------------------------

*** 2021-09-30 15:27:47.306
skdstdst()+41        call     kgdsdst()            000000000 ?000000000 ?
                                                   7FFDE0D2CA80 ?7FFDE0D2CB58 ?
                                                   7FFDE0D31600 ?000000002 ?
ksedst1()+103        call     skdstdst()           000000000 ?000000000 ?
                                                   7FFDE0D2CA80 ?7FFDE0D2CB58 ?
                                                   7FFDE0D31600 ?000000002 ?
ksedst()+39          call     ksedst1()            000000000 ?000000001 ?
                                                   7FFDE0D2CA80 ?7FFDE0D2CB58 ?
                                                   7FFDE0D31600 ?000000002 ?
dbkedDefDump()+2746  call     ksedst()             000000000 ?000000001 ?
                                                   7FFDE0D2CA80 ?7FFDE0D2CB58 ?
                                                   7FFDE0D31600 ?000000002 ?
ksedmp()+41          call     dbkedDefDump()       000000003 ?000000000 ?
                                                   7FFDE0D2CA80 ?7FFDE0D2CB58 ?
                                                   7FFDE0D31600 ?000000002 ?
dbkdaKsdActDriver()  call     ksedmp()             000000003 ?000000000 ?
+1960                                              7FFDE0D2CA80 ?7FFDE0D2CB58 ?
                                                   7FFDE0D31600 ?000000002 ?
dbgdaExecuteAction(  call     dbkdaKsdActDriver()  7F0DE7A1F730 ?7FFDE0D33D00 ?
)+1065                                             7FFDE0D2CA80 ?7FFDE0D2CB58 ?
                                                   7FFDE0D31600 ?000000002 ?
...
Starting SQL statement dump
SQL Information
user_id=703 user_name=ZKM module=SQL*Plus action=
sql_id=2611xga5f8w95 plan_hash_value=0 problem_type=0
----- Current SQL Statement for this session (sql_id=2611xga5f8w95) -----
select * from no
sql_text_length=17
sql=select * from no
Optimizer state dump:
Compilation Environment Dump
optimizer_mode_hinted               = false
optimizer_features_hinted           = 0.0.0
parallel_execution_enabled          = true
parallel_query_forced_dop           = 0
...
You can see that there is enough information.
Similar Posts:
- [Solved] ORACLE 11g ORA-20000: Unable to analyze TABLE “AA”.”CMP3$87651″, insufficient…
- ORA-00600: internal error code, arguments: [ktecgsc:kcbz_objdchk], [0], [0], [1], [], [], [], [], [], [], [], []
- Unknown system variable ‘storage_engine’
- Postgres invalid command data recovery processing
- ORA-12518 TNSlistener could not hand off client connection [Solved]
- oracle No more data to read from socket ora-07445 [How to Solve]
- [Solved] Insufficient Oracle table space: ora-01653: unable to extend table
- [Solved] 64-bit Python calls 32-bit Oracle client error: Cx_Oracle.DatabaseError: DPI-1047
- How to Solve Error: Oracle11g alarm log error ora-04030
- SET SQL_MODE=”NO_AUTO_VALUE_ON_ZERO”