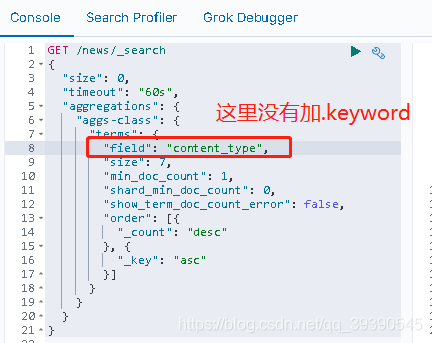
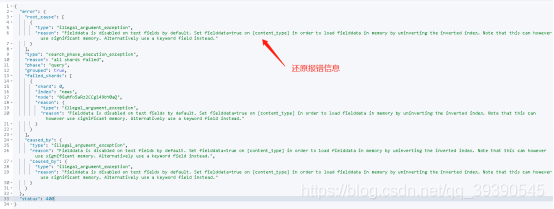
when configuring elk, I usually encounter the following error reports, which are sorted as follows (under continuous update):
elasticsearch failed to start
# systemctl start elasticsearch
Job for elasticsearch.service failed because the control process exited with error code. See "systemctl status elasticsearch.service" and "journalctl -xe" for details.

#At this point, check the system logs directly, as elasticsearch does not have a dedicated log audit
tail -f /var/log/messages
The following errors are reported:
Dec 13 10:16:30 oldboy elasticsearch: ERROR: [1] bootstrap checks failed
Dec 13 10:16:30 oldboy elasticsearch: [1]: initial heap size [536870912] not equal to maximum heap size [775946240]; this can cause resize pauses and prevents mlockall from locking the entire heap
In fact, the prompt is obvious. The memory given by the JVM is insufficient, so we can directly increase the memory
#Modify jvm memory size
# vim /etc/elasticsearch/jvm.options
-Xms1500m
-Xms1500m
# Because I just changed the memory to a very small size, just change it back
If you do not use the SYSTEMd method to start, you can directly call bin/elasticsearch to start. There are several points to note
#1. You cannot use root to log in
useradd elk #Create the user elk

#2. Give elk the user rights involved
kibana displays Chinese garbled code
#First check what the format of the log to pull is
file file.txt #View on linux

Open the log file in notepad and click save as to see if it says ANSI, then it is gbk # on windows

# Configure the character set in filebeat

# vim /etc/filebeat/filebeat.yml

filebeat.inputs:

- type: log


  enabled: true

  paths:
    - c:\work\CA*
  encoding: gbk   #Add the character format here, if it is utf8 then no need to add
Continue to generate the test log, log in to kibana and check it. It is found that the Chinese characters have been displayed normally and there is no garbled code
after the ES cluster configuration xpack is started, the password creation fails
[root@db01 elasticsearch]# bin/elasticsearch-setup-passwords interactive

Failed to determine the health of the cluster running at http://10.0.0.200:9200
Unexpected response code [503] from calling GET http://10.0.0.200:9200/_cluster/health?pretty
Cause: master_not_discovered_exception

It is recommended that you resolve the issues with your cluster before running elasticsearch-setup-passwords.
It is very likely that the password changes will fail when run against an unhealthy cluster.

Do you want to continue with the password setup process [y/N]y

Initiating the setup of passwords for reserved users elastic,apm_system,kibana,logstash_system,beats_system,remote_monitoring_user.
You will be prompted to enter passwords as the process progresses.
Please confirm that you would like to continue [y/N]y


#Error, cluster link fails when starting xpack because of dirty data

# Ultimate trick (only for initial cluster creation, or test environments)

1. Stop the service
2. Delete the data directory
3. Configure only xpack.security.enabled: true for all three nodes, start
4. set password

# configuration file (all three are the same except for the ip)
cluster.name: think
node.name: node-1
path.data: /var/lib/elasticsearch
path.logs: /var/log/elasticsearch
bootstrap.memory_lock: true
network.host: 10.0.0.200,127.0.0.1
http.port: 9200
discovery.seed_hosts: ["10.0.0.200", "10.0.0.201"]
cluster.initial_master_nodes: ["10.0.0.200", "10.0.0.201","10.0.0.202"]
http.cors.enabled: true
http.cors.allow-origin: "*"
xpack.security.enabled: true


#Test results
[root@db01 elasticsearch]# bin/elasticsearch-setup-passwords interactive
Initiating the setup of passwords for reserved users elastic,apm_system,kibana,logstash_system,beats_system,remote_monitoring_user.
You will be prompted to enter passwords as the process progresses.
Please confirm that you would like to continue [y/N]y


Enter password for [elastic]:
Reenter password for [elastic]:
Enter password for [apm_system]:
Reenter password for [apm_system]:
Enter password for [kibana]:
Reenter password for [kibana]:
Enter password for [logstash_system]:
Reenter password for [logstash_system]:
Enter password for [beats_system]:
Reenter password for [beats_system]:
Enter password for [remote_monitoring_user]:
Reenter password for [remote_monitoring_user]:
Changed password for user [apm_system]
Changed password for user [kibana]
Changed password for user [logstash_system]
Changed password for user [beats_system]
Changed password for user [remote_monitoring_user]
Changed password for user [elastic]

#success
4. The same situation as that in title 3 occurs at work the next day. The following solutions are provided
#Directly pair with ca certificate authentication and turn on ssl

# Set the default role password
bin/elasticsearch-setup-passwords interactive # This step didn't work for me, but title 3 had already been created, so I skipped it

Add the following to the elasticsearch.yml
xpack.security.transport.ssl.enabled: true
xpack.security.transport.ssl.verification_mode: certificate # certificate verification level
xpack.security.transport.ssl.keystore.path: certs/elastic-certificates.p12 # node certificate path
xpack.security.transport.ssl.truststore.path: certs/elastic-certificates.p12

# Create the certificate
# Create the keystore file
# bin/elasticsearch-keystore create # You don't need to do this step if you have it in the config folder

# Generate the CA certificate, keep entering
bin/elasticsearch-certutil ca (CA certificate: elastic-stack-ca.p12)

# Generate the certificate to be used by the node, keep entering
bin/elasticsearch-certutil cert --ca elastic-stack-ca.p12 (node certificate: elastic-certificates.p12)

# Create a directory to save the certificate and move it to the config file
mkdir -p /etc/elasticsearch/certs
mv elastic-certificates.p12 /etc/elasticsearch/certs
chmod 777 /etc/elasticsearch/certs #You can't log in without giving authorization, so you can test yourself to see how much is appropriate

#Restart

