http://www.sthda.com/english/wiki/ggplot2-texts-add-text-annotations-to-a-graph-in-r-software
Install required packages
Create some data
Text annotations using geom_text and geom_label
Change the text color and size by groups
Add a text annotation at a particular coordinate
annotation_custom : Add a static text annotation in the top-right, top-left, …
ggrepel: Avoid overlapping of text labels
Scatter plots with text annotations
Volcano plot
Infos
This article describes how toadd a textannotation to a plot generated usingggplot2package.
The functions below can be used :
geom_text(): adds text directly to the plot
geom_label(): draws a rectangle underneath the text, making it easier to read.
annotate(): useful for adding small text annotations at a particular location on the plot
annotation_custom(): Adds static annotations that are the same in every panel
It’s also possible to use the R packageggrepel, which is an extension and providesgeomfor ggplot2 to repeloverlapping textlabels away from each other.
We’ll start by describing how to use ggplot2 official functions for adding text annotations. In the last sections, examples usingggrepelextensions are provided.
Install required packages
# Install ggplot2
install.packages("ggplot2") # Install ggrepel install.packages("ggrepel")
Create some data
We’ll use a subset of mtcars data. The functionsample() can be used to randomly extract 10 rows:
# Subset 10 rows
set.seed(1234) ss <- sample(1:32, 10) df <- mtcars[ss, ]
Text annotations using geom_text and geom_label
library(ggplot2)
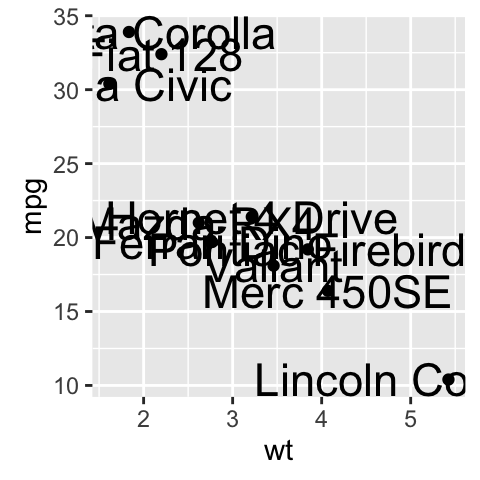
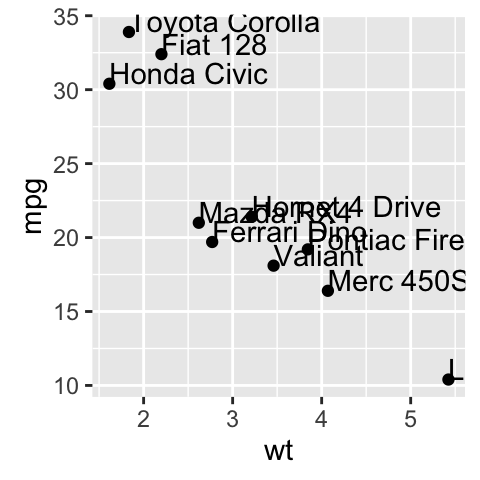
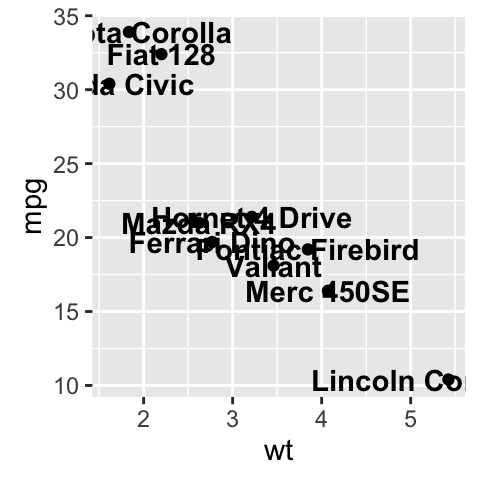
# Simple scatter plot sp <- ggplot(df, aes(wt, mpg, label = rownames(df)))+ geom_point() # Add texts sp + geom_text() # Change the size of the texts sp + geom_text(size=6) # Change vertical and horizontal adjustement sp + geom_text(hjust=0, vjust=0) # Change fontface. Allowed values : 1(normal), # 2(bold), 3(italic), 4(bold.italic) sp + geom_text(aes(fontface=2))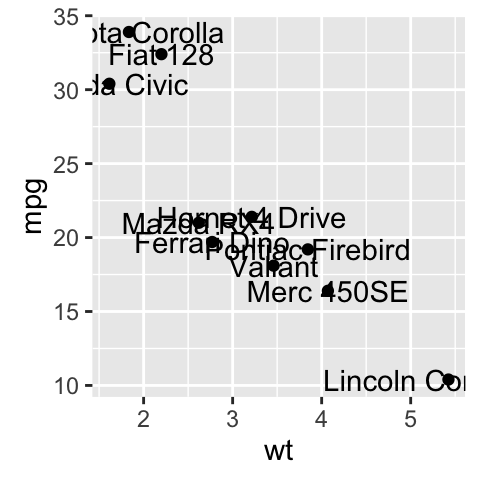
Change font family
sp + geom_text(family = "Times New Roman")geom_label() works likegeom_text() but draws a rounded rectangle underneath each label. This is useful when you want to label plots that are dense with data.
sp + geom_label()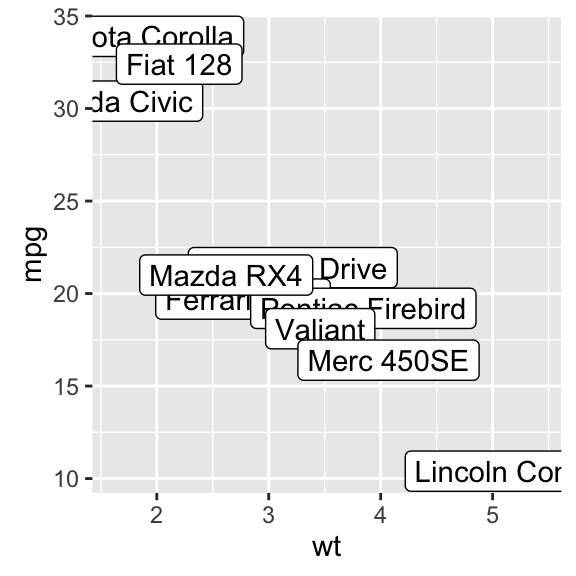
Others useful arguments forgeom_text() andgeom_label() are:
nudge_xandnudge_y: let you offset labels from their corresponding points. The functionposition_nudge() can be also used.
check_overlap= TRUE: for avoiding overplotting of labels
hjustandvjustcan now be character vectors (ggplot2 v >= 2.0.0): “left”, “center”, “right”, “bottom”, “middle”, “top”. New options include “inward” and “outward” which align text towards and away from the center of the plot respectively.
Change the text color and size by groups
It’s possible to change the appearance of the texts using aesthetics (color, size,…) :
sp2 <- ggplot(mtcars, aes(x=wt, y=mpg, label=rownames(mtcars)))+ geom_point() # Color by groups sp2 + geom_text(aes(color=factor(cyl)))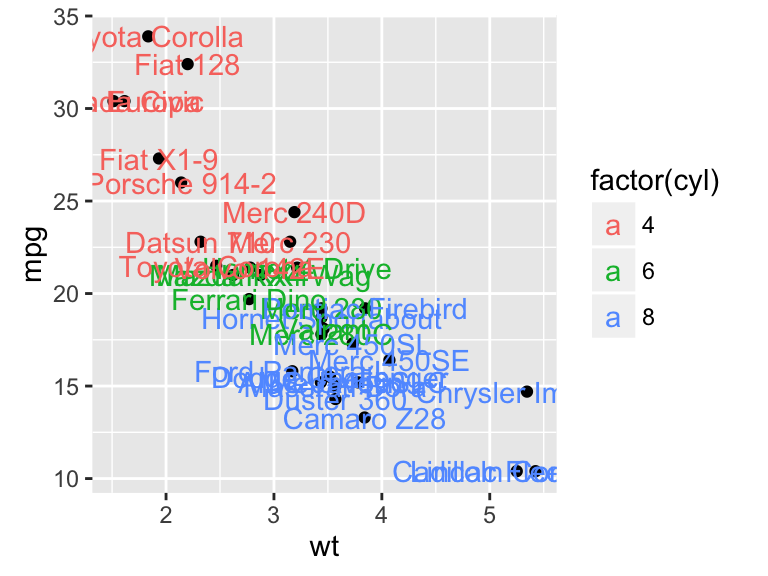
# Set the size of the text using a continuous variable
sp2 + geom_text(aes(size=wt))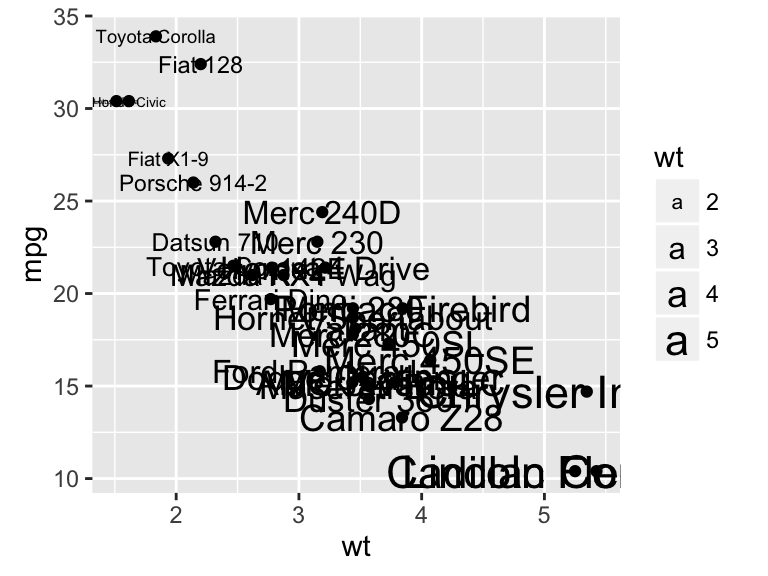
# Define size range
sp2 + geom_text(aes(size=wt)) + scale_size(range=c(3,6))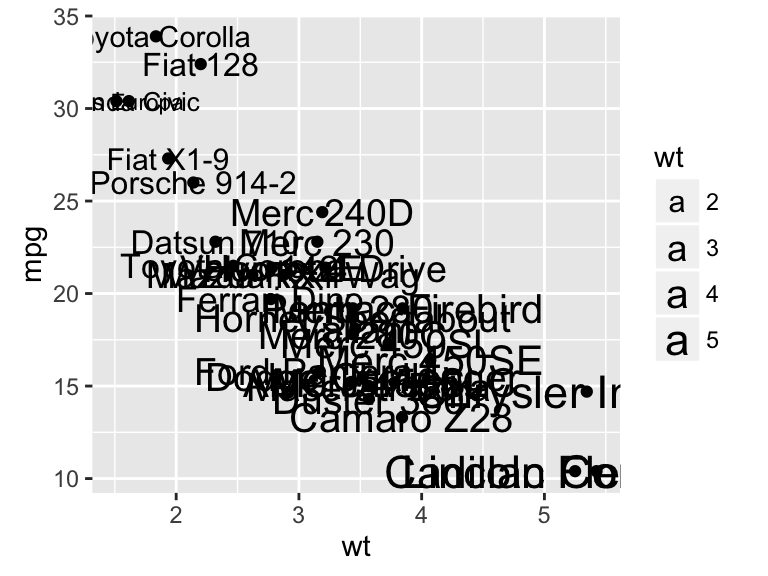
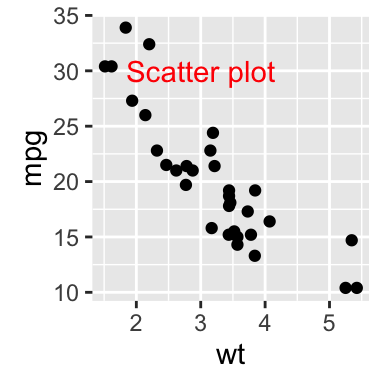
Add a text annotation at a particular coordinate
The functionsgeom_text()andannotate()can be used :
# Solution 1
sp2 + geom_text(x=3, y=30, label="Scatter plot") # Solution 2 sp2 + annotate(geom="text", x=3, y=30, label="Scatter plot", color="red")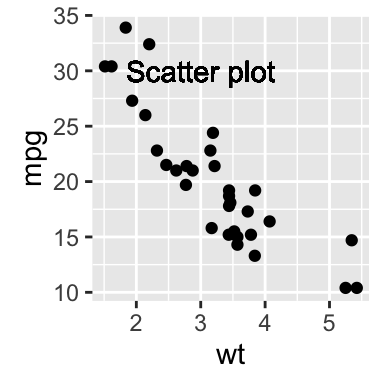
annotation_custom : Add a static text annotation in the top-right, top-left, …
The functionsannotation_custom()andtextGrob()are used to add static annotations which are the same in every panel.Thegridpackage is required :
library(grid)
# Create a text grob <- grobTree(textGrob("Scatter plot", x=0.1, y=0.95, hjust=0, gp=gpar(col="red", fontsize=13, fontface="italic"))) # Plot sp2 + annotation_custom(grob)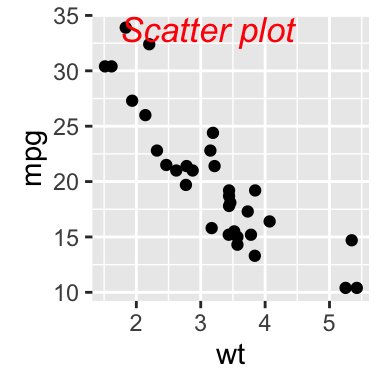
Facet: In the plot below, the annotation is at the same place (in each facet) even if the axis scales vary.
sp2 + annotation_custom(grob)+facet_wrap(~cyl, scales="free")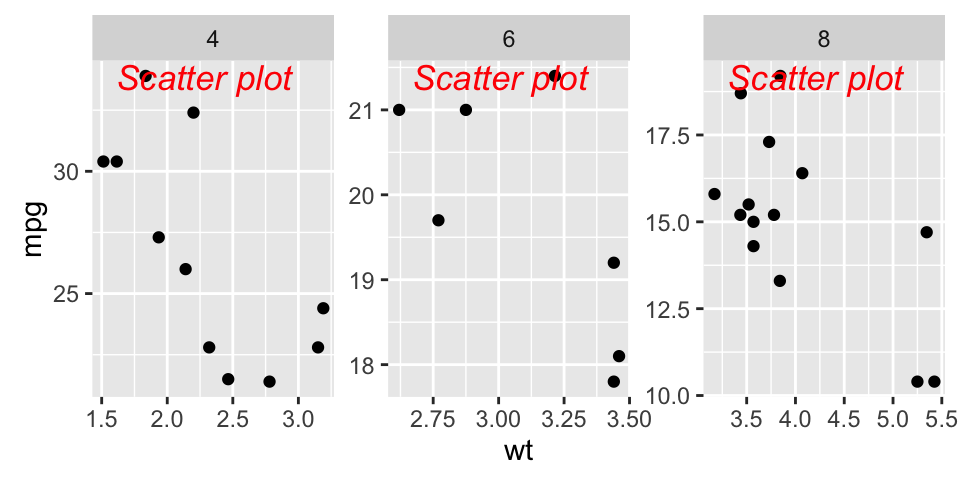
ggrepel: Avoid overlapping of text labels
There are two important functions inggrepelR packages:
geom_label_repel()
geom_text_repel()
Scatter plots with text annotations
We start by creating a simple scatter plot using a subset of themtcarsdata set containing 15 rows.
Prepare some data:
# Take a subset of 15 random points
set.seed(1234) ss <- sample(1:32, 15) df <- mtcars[ss, ]
Create a scatter plot:
p <- ggplot(df, aes(wt, mpg)) + geom_point(color = 'red') + theme_classic(base_size = 10)Add text labels:
# Add text annotations using ggplot2::geom_text
p + geom_text(aes(label = rownames(df)), size = 3.5)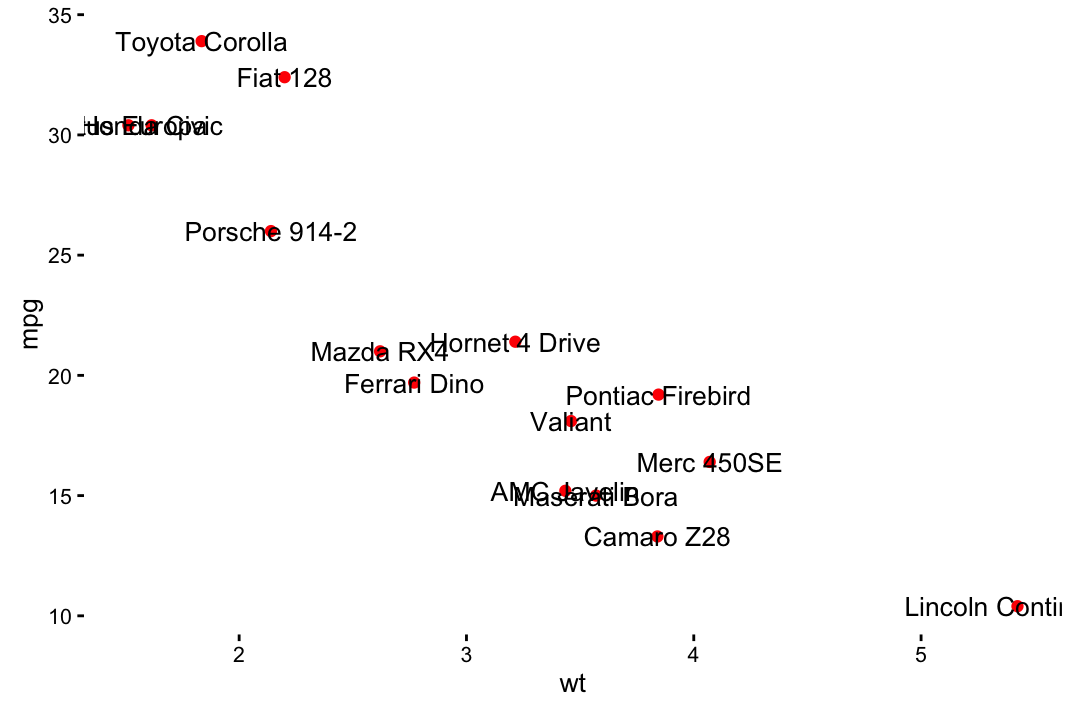
# Use ggrepel::geom_text_repel
require("ggrepel") set.seed(42) p + geom_text_repel(aes(label = rownames(df)), size = 3.5) 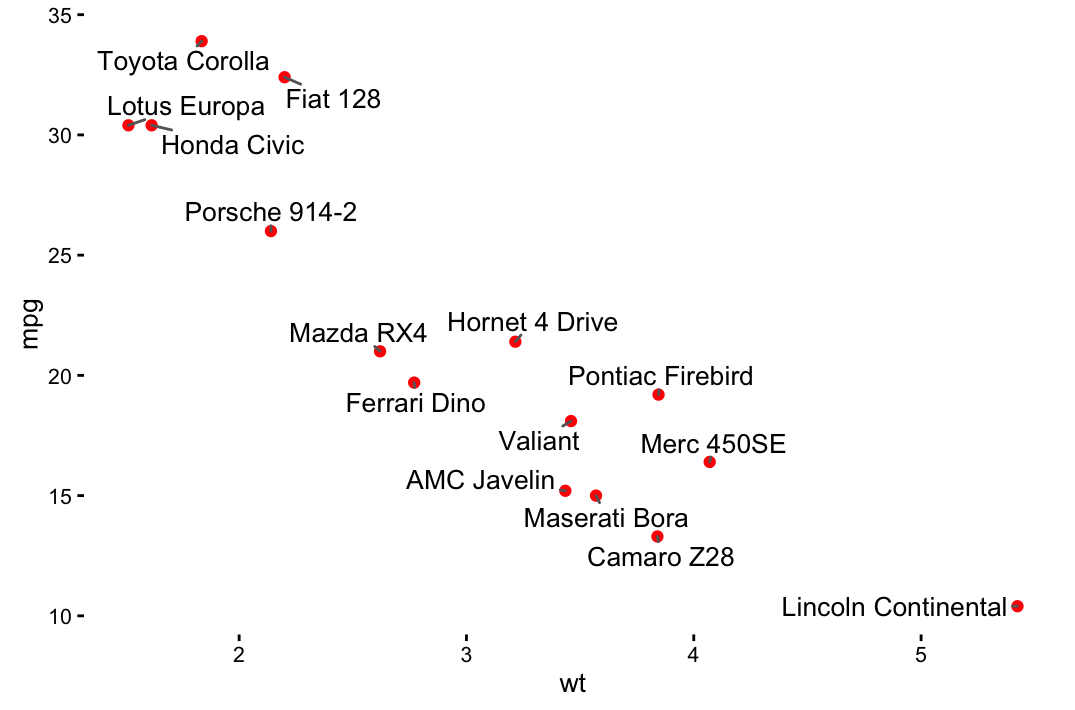
# Use ggrepel::geom_label_repel and
# Change color by groups
set.seed(42) p + geom_label_repel(aes(label = rownames(df), fill = factor(cyl)), color = 'white', size = 3.5) + theme(legend.position = "bottom")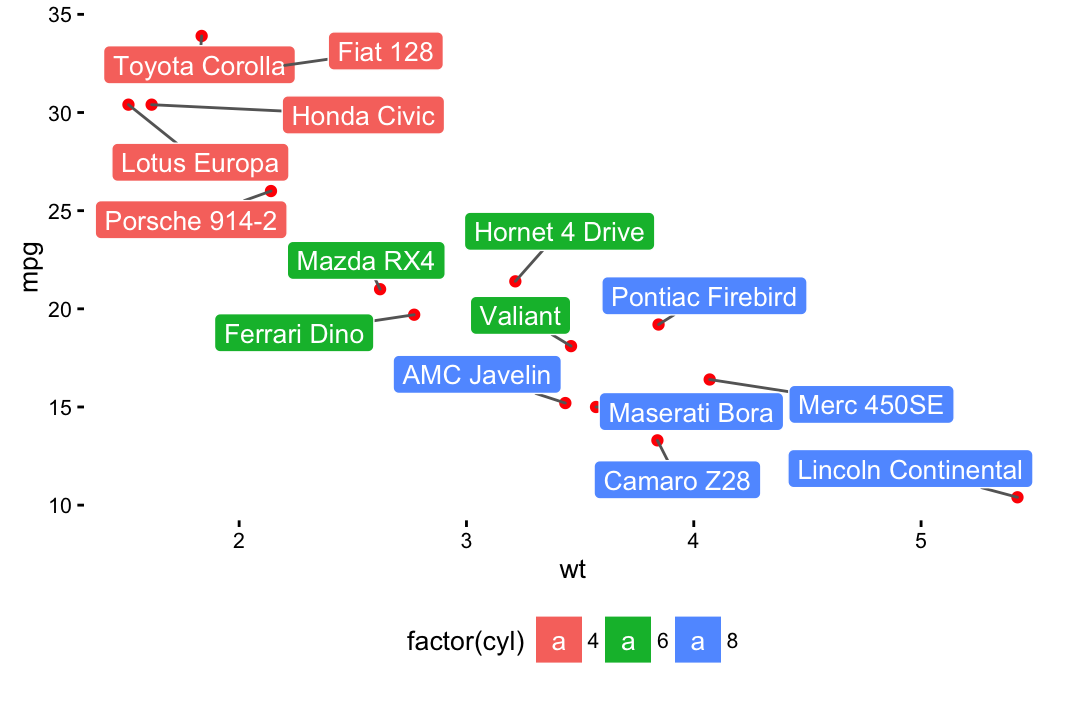
Volcano plot
genes <- read.table("https://gist.githubusercontent.com/stephenturner/806e31fce55a8b7175af/raw/1a507c4c3f9f1baaa3a69187223ff3d3050628d4/results.txt", header = TRUE) genes$Significant <- ifelse(genes$padj < 0.05, "FDR < 0.05", "Not Sig") ggplot(genes, aes(x = log2FoldChange, y = -log10(pvalue))) + geom_point(aes(color = Significant)) + scale_color_manual(values = c("red", "grey")) + theme_bw(base_size = 12) + theme(legend.position = "bottom") + geom_text_repel( data = subset(genes, padj < 0.05), aes(label = Gene), size = 5, box.padding = unit(0.35, "lines"), point.padding = unit(0.3, "lines") )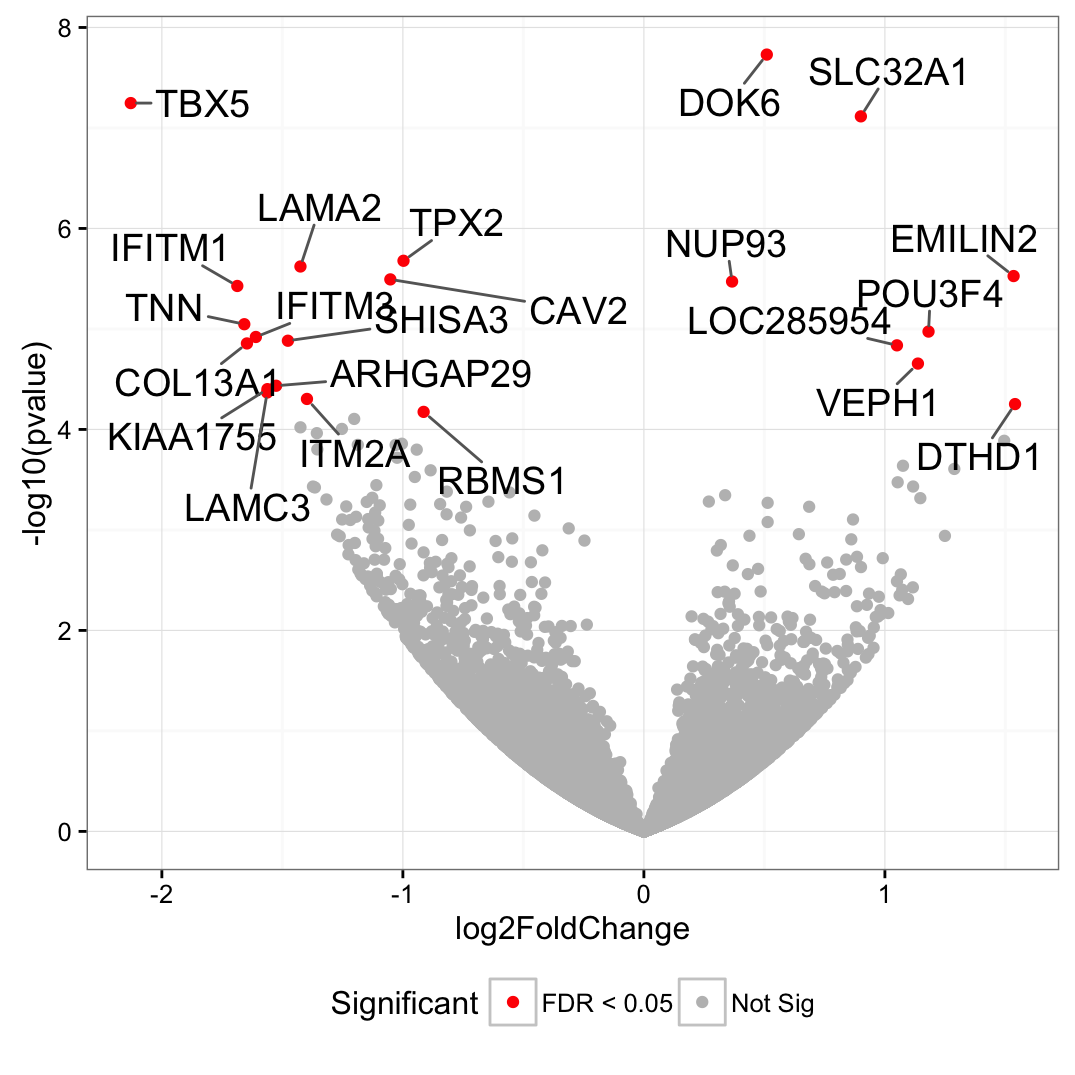
source
Similar Posts:
- [Solved] Error in ans[ypos] <- rep(yes, length.out = len)[ypos] : replacement has length zero
- C#: How to Add Ink Annotation in PDF
- [Solved] Pycharm Error: Error: failed to send plot to http://127.0.0.1:63342
- only size-1 arrays can be converted to Python scalars
- Solution to GPU memory leak problem of tensorflow operation efficiency
- Tag code error valueerror: bad input shape()
- Solution to the problem of consider defining a bean of type ‘xxx’ in your configuration in spring boot auto injection
- Wkt to geojson (for multipole)
- [Solved] Pandas Read CSV Error: TypeError: Empty ‘DataFrame’: no numeric data to plot
- [Solved] RuntimeError: one_hot is only applicable to index tensor