Simple code, using the panda module to read the CSV data file, there are two ways, one is abandoned by the new version of panda series. From_ csv; The other is panda. Read_ csv
First of all, the problem is that when reading a CSV file, the default data is object type, so there is no character type data to plot. At this time, you only need to convert the type, as follows:
from pandas import Series
import matplotlib.pyplot as plt
data = Series.from_csv('daily.csv',header=0)
#print(data.head())
data.astype(float)
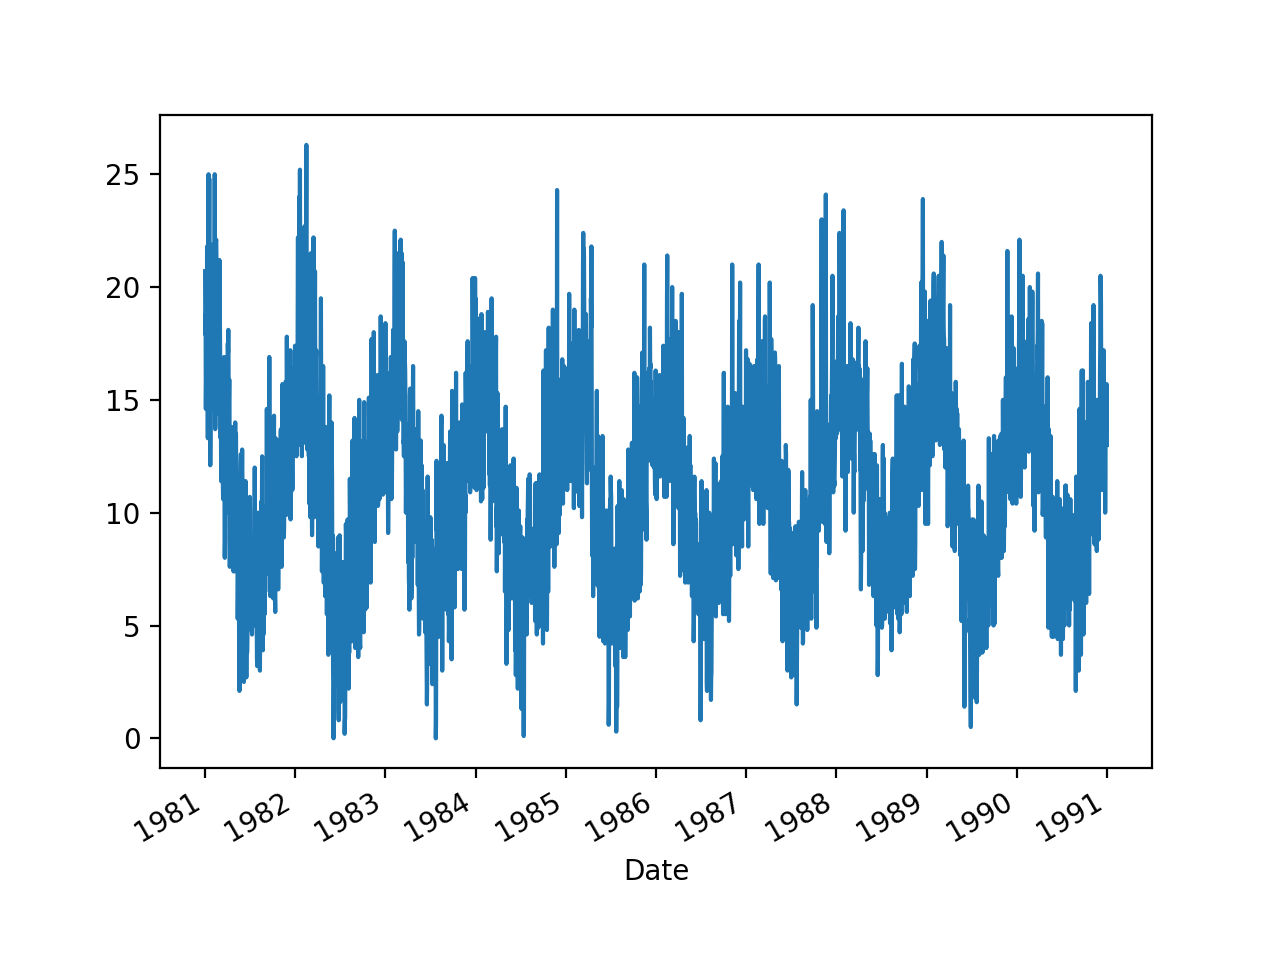
data.plot()
plt.show()To solve this problem perfectly, the following figure is drawn:
This is the desired result, so the other is panda. Read_ CSV, you are not so lucky. You will find this kind of data stored in CSV:
1981/1/1,20.7
1981/1/2,17.9
1981/1/3,18.8
1981/1/4,14.6
1981/1/5,15.8
1981/1/6,15.8
1981/1/7,15.8
1981/1/8,17.4
1981/1/9,21.8
1981/1/10,20
1981/1/11,16.2
1981/1/12,13.3
1981/1/13,16.7
1981/1/14,21.5
It can’t be displayed as X-axis label, so I changed the first column to 1981… To solve the problem. At this time, of course, we don’t recommend using the second method. If it’s so troublesome, we can use pandas to draw directly by PLT
Finally, we must pay attention to whether the data is abnormal. Some abnormal data are text exceptions, while some may be semantic exceptions. We need to mine and remove the abnormal data. This is often very important. Of course, drawing is often one of the more intuitive ways
Similar Posts:
- Python Pandas TypeError: Empty ‘DataFrame’: no numeric data to plot
- Python pandas.read_ Oserror: initializing from file failed
- Import pandas encountered no module named pandas in pychar
- How to Solve ParserError: Error tokenizing data. C error: Expected 2 fields in line 53, saw 3
- pandas.read_ Oserror: initializing from file failed
- How to solve the problem of “no observations” in Stata?
- Problem solving: error in reading CSV file by Panda: typeerror: invalid type comparison
- Python: How to Read file initialization from file failed by panda
- How to Solve sys:1: DtypeWarning: Columns (39,41,42,217) have mixed types.Specify dtype option on import or s
- [Solved] Hibernate database dialect configuration; no dialect mapping for jdbc type:-9; Rare words