C content distribution map per sequence GC content
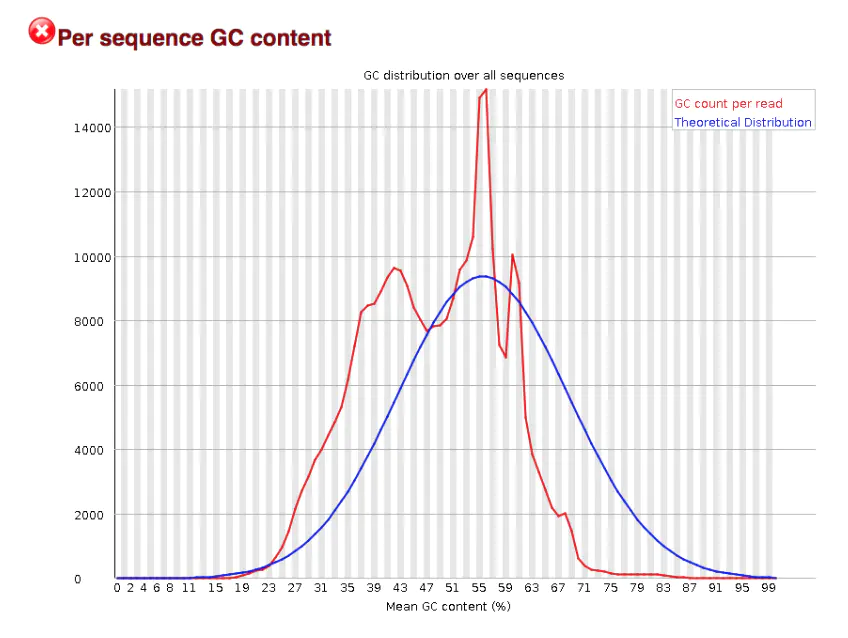
This graph should theoretically conform to the normal distribution (i.e. bell curve) , unless there are over represented sequences [i.e. there is a sharp peak on the basis of normal distribution], or there is pollution of other species [i.e. multiple peaks]
It can be seen from this figure that this should be the case that is in line with the over expression sequence, indicating that either there is sequence contamination or there is a gene with extremely high expression in the sequence
sequence duplication levels
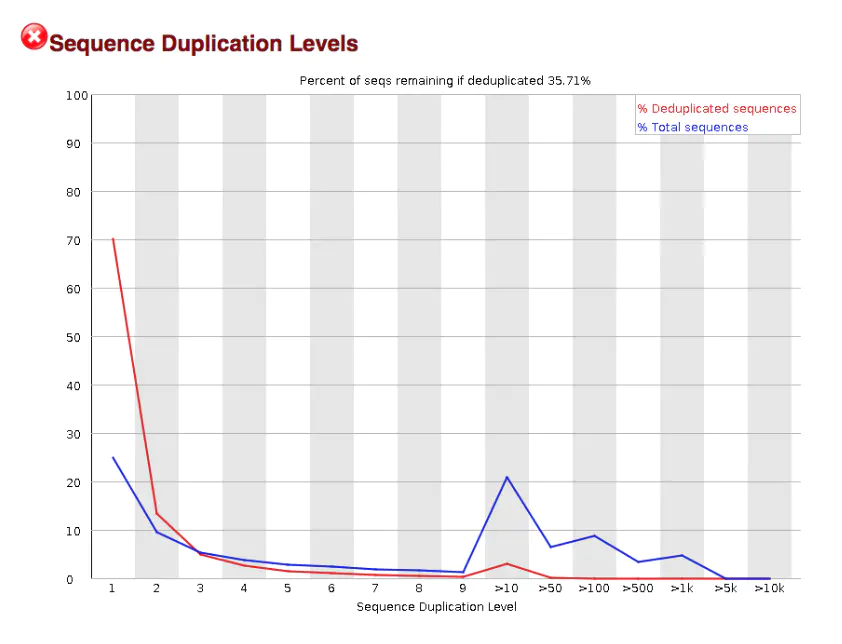
This map can help to judge the complexity of the library. If the number of PCR amplification is too many or the initial amplification substrate is too few, the complexity of the library will be reduced
As can be seen in this figure, seems to have a large number of repetitive sequences, that is to say, the complexity of the library is low, which may be related to the overexpression of a gene
over expressed sequences
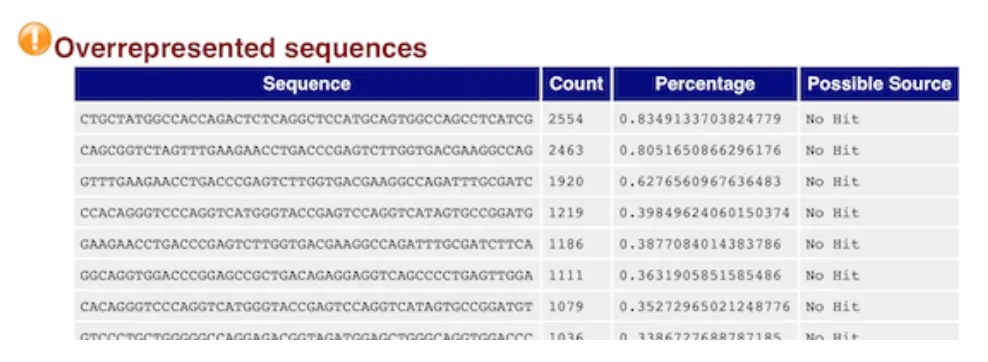
this table is also very important
It shows the length of at least 20 BP, the number of more than 0.1% of the total number of reads base composition, it can help to determine pollution (such as: carrier, adaptor sequence)
If the above GC content distribution is “hung”, this table can help us to determine the source. If it is a known carrier or connector, it will be listed if not, you can copy the sequence to blast
For example, here, we can copy the first sequence with the most expression to blast, and then find that it is actually a gene, so we can verify the previous conjecture: gene overexpression
Similar Posts:
- Program error: the table or view does not exist [Solved]
- SET SQL_MODE=”NO_AUTO_VALUE_ON_ZERO”
- An association from the table content refers to an
- Qt qt.qpa.xcb: QXcbConnection: XCB error: 8 (BadMatch)…..
- Postgres invalid command data recovery processing
- [Solved] Greenplum Use the Storage Error: function cannot execute on a QE slice because it accesses relation
- Tidyverse Error: Error: Problem with `summarise()` input `..1`.
- mysqldump unknown table ‘column_statistics’
- Consider using the `–user` option or check the permissions.
- [Solved] SQLSTATE[23000]: Integrity constraint violation: 1048 Column ‘vod_content’.