Zend Studio 9 configure and install Zend debugger
ZendDebugger-5.2.14-cygwin_ Nt-i386.zip download address http://dl.dbank.com/c0bmg4px8j
1. Unzip zenddebugger-5.2.14-cygwin_ nt-i386.zip
2. The following is a list of all files in the compressed package:
zenddebugger-5.2.14rc9-cygwin_ nt-i386/md5
ZendDebugger-5.2.14RC9-cygwin_ nt-i386/ Inventory.xml
ZendDebugger-5.2.14RC9-cygwin_ nt-i386/4_ 3_ x_ comp
ZendDebugger-5.2.14RC9-cygwin_ nt-i386/4_ 3_ x_ comp/ ZendDebugger.dll
ZendDebugger-5.2.14RC9-cygwin_ nt-i386/4_ 4_ x_ comp
ZendDebugger-5.2.14RC9-cygwin_ nt-i386/4_ 4_ x_ comp/ ZendDebugger.dll
ZendDebugger-5.2.14RC9-cygwin_ nt-i386/5_ 0_ x_ comp
ZendDebugger-5.2.14RC9-cygwin_ nt-i386/5_ 0_ x_ comp/ ZendDebugger.dll
ZendDebugger-5.2.14RC9-cygwin_ nt-i386/5_ 1_ x_ comp
ZendDebugger-5.2.14RC9-cygwin_ nt-i386/5_ 1_ x_ comp/ ZendDebugger.dll
ZendDebugger-5.2.14RC9-cygwin_ nt-i386/5_ 2_ x_ comp
ZendDebugger-5.2.14RC9-cygwin_ nt-i386/5_ 2_ x_ comp/ ZendDebugger.dll
ZendDebugger-5.2.14RC9-cygwin_ nt-i386/5_ 2_ x_ nts_ comp
ZendDebugger-5.2.14RC9-cygwin_ nt-i386/5_ 2_ x_ nts_ comp/ ZendDebugger.dll
ZendDebugger-5.2.14RC9-cygwin_ nt-i386/ dummy.php
ZendDebugger-5.2.14RC9-cygwin_ nt-i386/ README.txt
3. Select the corresponding file according to your PHP version. My PHP is 5.2.6, so I choose Zend debugger-5.2.14rc9-cygwin_ nt-i386/5_ 2_ x_ nts_ Comp, put this folder into your D:// Wamp folder (for the convenience of management, my server services are installed in files), and the full path is D:// Wamp/zenddebugger/5_ 2_ x/ ZendDebugger.dll
4. Compress the dummy.php Unzip it to the web root directory. The document root of my Apache is set at D/Wamp/Apache/htdoc and D/www, and then copy it dummy.php Go to D/Wamp/Apache/HtDocs and D/www, then modify php.ini , adding these contents:
zend_ extension_ ts=D:/myserver/ZendDebugger/5_ 2_ x/ ZendDebugger.dll
zend_ debugger.allow_ hosts=127.0.0.1/32,192.168.1.88/24
zend_ debugger.expose_ remotely=always
5. Then restart Apache. After a little wait, we enter phpinfo() to see if it is successful?
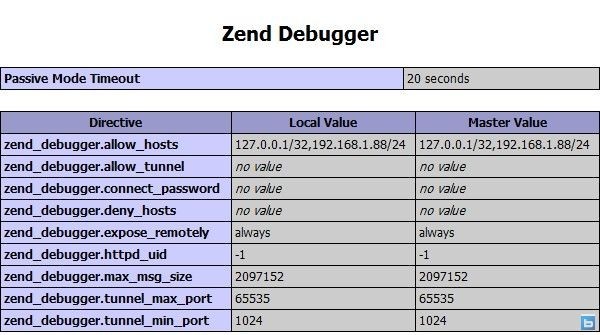
What appears in this picture is success
6. Use settings
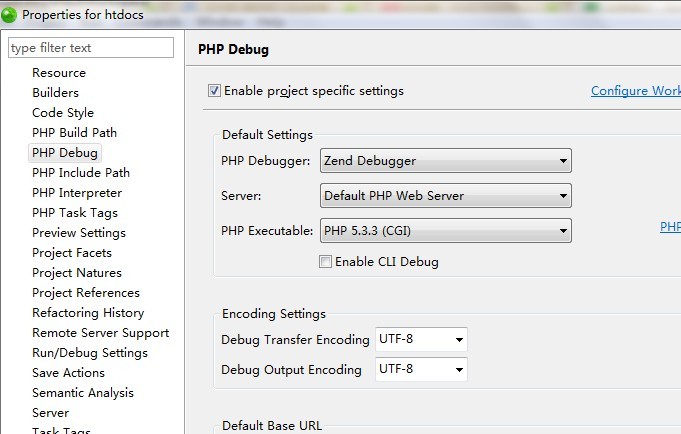
to use Zend debugger, we need to open Zend studio and set the debug configuration options of Zend studio. The steps are as follows: right click on your project – &> properties and select the PHP debug option  on the left
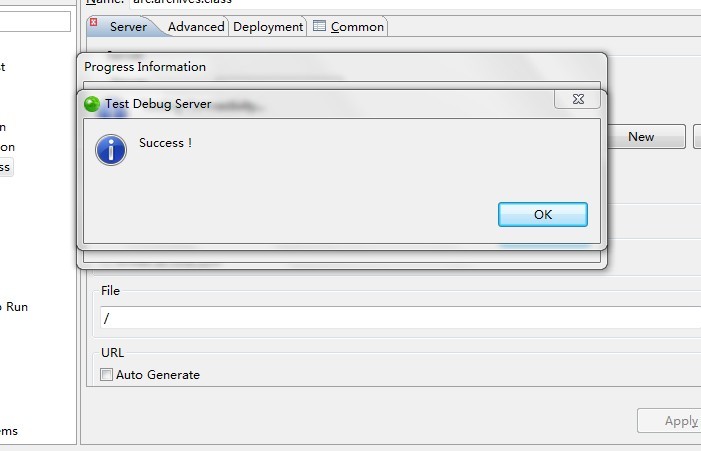
In addition to the above setting method, Zend studio debug has another setting method, mainly for a single debugging file. The method is as follows: select Run – & gt in the menu bar; Debug configurations, select the debug page in PHP web page debug mode, select Zend debugger in the server panel on the right, and you can click test debugger. If Zend debugger is installed successfully, the test debugger server success dialog box will pop up, that is, the connection of Zend debug server is successful
7 use
Select debug as or debug URL in the menu bar run to debug. The debug interface of Zend debugger in Zend studio is similar to Xdebug. You can also start debugging session through F11, F5 (single step debugging), set breakpoint, etc.
Similar Posts:
- PHP: using Zend to encrypt the source code, Zend guard installation and Zend guard run time support missing
- Windows php Call to undefined function curl_init()
- vshost.exe What is the purpose of the document?
- How to Solve Mybatis Chinese parameter error
- How to connect Android mobile phone with ADB & reasons and solutions of unable to connect to 192.168.1.100:5555
- _DEBUGGER _03 _Server Tomcat v8.0 Server at localhost was unable to start within xx seconds
- Summary of WebKit compiling on Windows platform
- The solution of losing vcruntime140.dll in the latest Apache installation
- com.sun.jdi.InvocationException occurred invoking method
- [Solved] SSH is disconnected as soon as it is connected