ZBx appears in ZABBIX custom key_ NOTSUPPORTED: Unsupported item key.
Category: Linux
2016-04-26 16:03:02
I haven’t done much ZABBIX before. In recent days, I have to monitor the master and slave of MySQL according to
basic rules http://www.linuxidc.com/Linux/2012-10/72552.htm
This can be done, but the client is ready. After restarting the service, the server can’t get the key, and the prompt is ZBx_ Notsupported: Unsupported item key.
all kinds of queries, close SELinux, release port through firewall, telnet client 10050 is connected, change agentd. After the configuration of
allowroot = 1
enable remote commands = 1
unsafeuserparameters = 1
, the service can not be restarted.
A little confused….
then it is found that the process started by the client is not listening to port 10050, so it can start the service directly by pkill – F ZABBIX
this time…
the article with the link address is below
Recently, we built a ZABBIX monitoring system in our company. Now we need to use ZABBIX to monitor the master-slave synchronization of MySQL
Now let’s talk about the detailed steps of configuration
1. First, assign a monitoring account to MySQL
mysql&> grant replication client on *.* to ‘zabbix’@’localhost’;
2. Write a script
Let’s carry out an order first
mysql -u zabbix -e ‘show slave status\G’
We choose from the output information
Slave_ IO_ Running: Yes
Slave_ SQL_ Running: Yes
These two are monitored
I tested it. When the operation data is abnormal, slave_ SQL_ Running will become No
When the slave stop is executed, both will become No
The script is as follows
#!/bin/bash
/usr/local/mysql/bin/mysql -uzabbix -e ‘show slave status\G’ |grep -E “Slave_ IO_ Running|Slave_ SQL_ Running”|awk ‘{print $2}’|grep -c Yes
I just wrote an order, and I’ll explain it
First, use ZABBIX to get all the states of the slave, then grep the two states, and then output the second column. Finally, check several yes states
Normally, there are two yes states
In fact, you will find that there is only one command, but I have written it into a script. Here I say, because if you write the command into the configuration file, you have to restart the agent after each modification, so it is more convenient to debug and modify it in the script. This should be a good habit.
3. Add monitoring items in agent
Add the following line at the end of the file
UserParameter= mysql.replication ,/home/zabbix/mysql- replication.sh
In the string after the equal sign, the comma is preceded by the key, followed by the script to be executed
After adding, restart the agent program
4. Add monitoring items on server
Go to the ZABBIX installation directory, and mine is/usr/local/ZABBIX/bin
Implementation./ZABBIX_ get -s 192.168.177.185 -k ” mysql.replication “
192.168.177.185 here is the IP address of my agent
If the master-slave copy is normal, 2 will be returned (indicating that both states are yes)
Now the server can get the status from the agent.
Now add monitoring items in the management interface
System configuration – Host – select the monitoring items of the host to be monitored
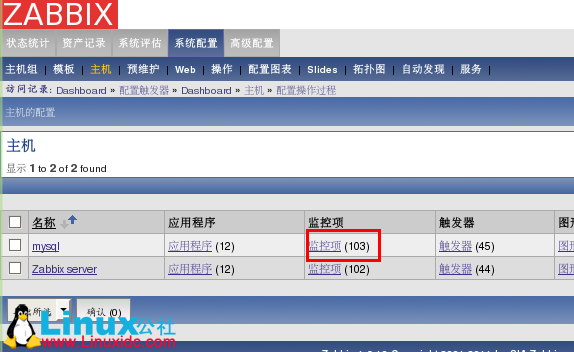
In the upper right corner, select Create item
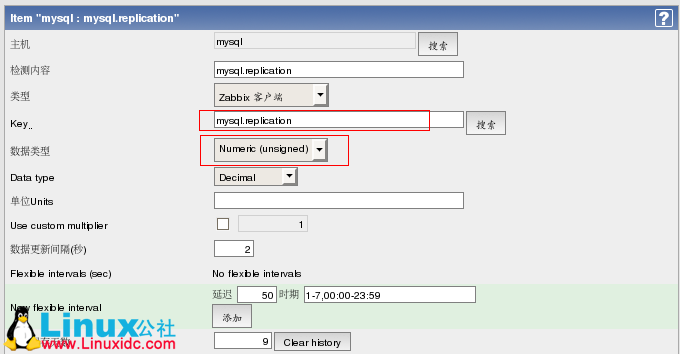
Note that the key here is the key filled in the agent configuration file, and the data type should also be numeric
The data update interval can be set according to your own needs. After creation, you can save it
Create trigger again
Enter the trigger and click create trigger
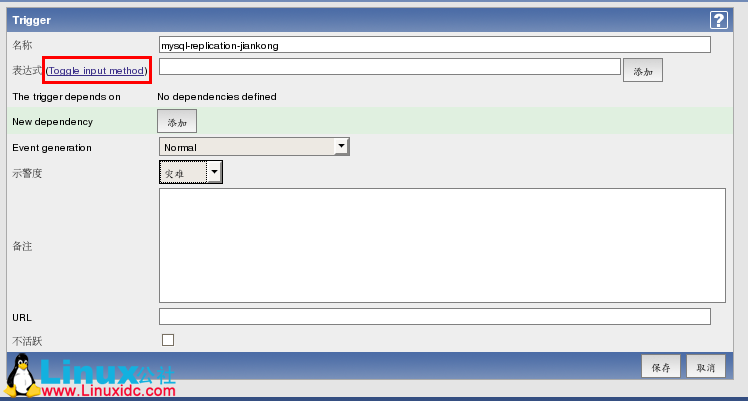
You can fill in the name here. The warning degree is disaster
Then there is the expression. After clicking the hyperlink, select the “Edit” button
In the pop-up connection, click search after item and select the monitoring item just created
There are some rules in function. We choose last value
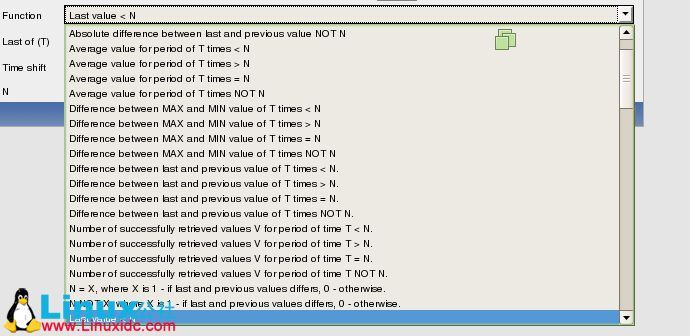
We set n to 2, that is, if it is less than 2 yes, the alarm will be given, and the rest will be ignored.
After setting, don’t forget to click the “add” button.
Finally, click save.
It’s configured here. At this time
At this time, we stop the replication process of MySQL, wait a moment, open the monitoring interface of ZABBIX, and select “status statistics” and “dashboard”
You can see the alarm.
We can also set the SMS alarm again, which will not be detailed here.
Similar Posts:
- How to Solve “unsupported item key” Common Error
- ZABBIX agent active mode monitoring
- Zabbix Warning: Too many processes on zabbix server
- ZABBIX monitoring port
- Solve the problem of “ZABBIX discoverer processes 75% busy” in CentOS
- Zabbix agent on Zabbix server is unreachable for 5 minutes
- Obstacle Elimination set: Slave_ IO_ R unning:No And slave_ IO_ R unning:Connecting reason
- Zabbix-server Error: No route to host [How to Solve]
- mysql Slave_IO_Running:NO [How to Solve]
- ZABBIX monitors the CPU temperature of Windows Server